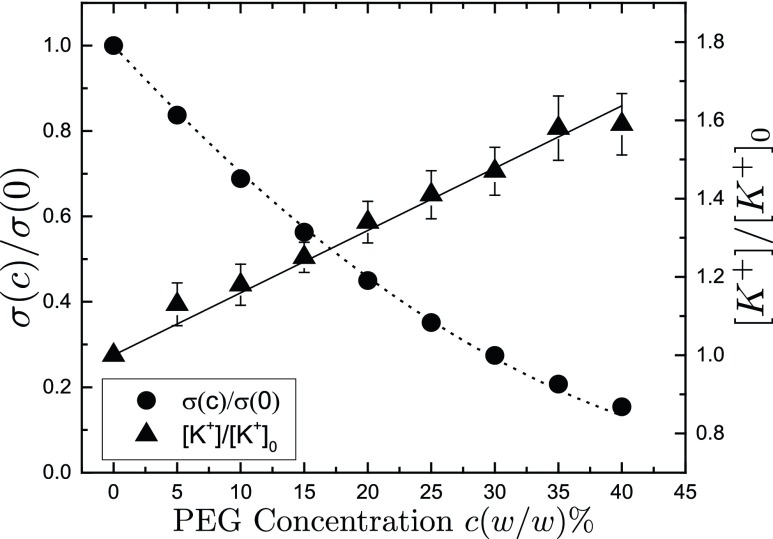
Fig. 2.
Normalized conductivity and effective ion concentrations of KCl solutions in the presence of PEG. PEG concentrations range from to (wt/wt). Dashed line corresponds to a fit to Eq. 2 with fitting parameter . Ion selective electrode measurements are made on 0.5 M KCl electrolyte solutions, where PEG concentrations range from to (wt/wt). Solid line corresponds to a fit to Eq. 3 with fitting parameter .

