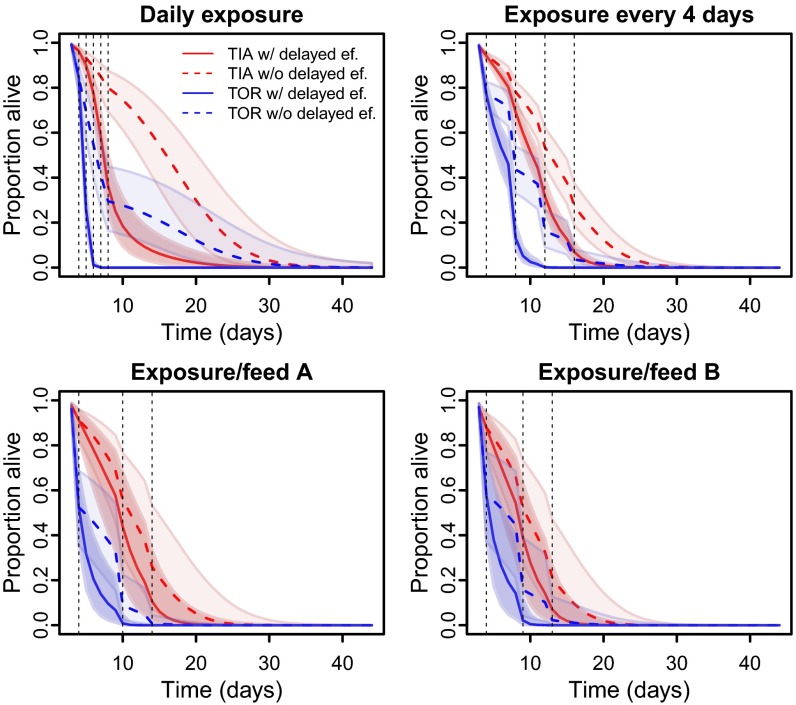
Fig. 3.
Modeled daily survival curves of An. gambiae after different exposure regimes to LLINs. Full lines represent the curve estimated from fitting the binomial model to the data, and the dotted lines represent the counterfactual curve predicted with no delayed effects. Lines correspond to the median prediction with shaded 95% credible intervals.

