Significance
Protein chaperone networks maintain homeostasis during cellular stress. Oncogenic transformation induces stress through increased demands on protein synthesis and folding. Thus, many cancer cells depend on proteostasis networks for optimal growth. However, the cancer subtype-specific roles of individual protein chaperones are incompletely understood. Through a chemical–genetic approach, we discovered an exquisite dependence of rhabdomyosarcoma (RMS) cells on cytosolic heat-shock protein 70 kDa (HSP70). HSP70 inhibition activates the unfolded protein response, and CEBP homologous protein is a key mediator of apoptosis and a candidate biomarker for efficacy. The link between a component required for cytosolic protein quality control and the endoplasmic reticulum stress response provides insight into cell type-specific wiring of proteostasis networks and suggests novel therapeutic avenues in RMS.
Keywords: HSP70, chaperone, cancer, sarcoma, unfolded protein response
Abstract
Cytosolic and organelle-based heat-shock protein (HSP) chaperones ensure proper folding and function of nascent and injured polypeptides to support cell growth. Under conditions of cellular stress, including oncogenic transformation, proteostasis components maintain homeostasis and prevent apoptosis. Although this cancer-relevant function has provided a rationale for therapeutically targeting proteostasis regulators (e.g., HSP90), cancer-subtype dependencies upon particular proteostasis components are relatively undefined. Here, we show that human rhabdomyosarcoma (RMS) cells, but not several other cancer cell types, depend upon heat-shock protein 70 kDA (HSP70) for survival. HSP70-targeted therapy (but not chemotherapeutic agents) promoted apoptosis in RMS cells by triggering an unfolded protein response (UPR) that induced PRKR-like endoplasmic reticulum kinase (PERK)–eukaryotic translation initiation factor α (eIF2α)–CEBP homologous protein (CHOP) signaling and CHOP-mediated cell death. Intriguingly, inhibition of only cytosolic HSP70 induced the UPR, suggesting that the essential activity of HSP70 in RMS cells lies at the endoplasmic reticulum–cytosol interface. We also found that increased CHOP mRNA in clinical specimens was a biomarker for poor outcomes in chemotherapy-treated RMS patients. The data suggest that, like human epidermal growth factor receptor 2 (HER2) amplification in breast cancer, increased CHOP in RMS is a biomarker of decreased response to chemotherapy but enhanced response to targeted therapy. Our findings identify the cytosolic HSP70–UPR axis as an unexpected regulator of RMS pathogenesis, revealing HSP70-targeted therapy as a promising strategy to engage CHOP-mediated apoptosis and improve RMS treatment. Our study highlights the utility of dissecting cancer subtype-specific dependencies on proteostasis networks to uncover unanticipated cancer vulnerabilities.
The synthesis and folding of proteins is a highly regulated process in both normal and malignant cells (1). The protein homeostasis (“proteostasis”) network that operates in cancer cells offers targets for therapeutic development, such as the proteasome and specific protein chaperones (2, 3). For example, the heat-shock protein 90 kDa (HSP90) chaperone maintains the stability of some mutant oncoproteins and permits the outgrowth of drug-resistant cells, fueling the development of small molecule HSP90 inhibitors as anticancer agents (4). Despite promising early results, these HSP90 inhibitors do not show large-scale clinical success across the majority of cancers tested (4). Proteasome inhibitor treatment has made a substantial impact on cancer patient outcomes but to date has been highly effective in only a small number of malignancies (5). Although the proteostasis network provides an increasingly rich landscape beyond these two targets, the dependence of particular cancer subtypes on specific proteostasis components is not well defined. Filling this knowledge gap is essential to elaborate the role of proteostasis in the pathogenesis of different malignancies and to identify cancer-specific vulnerabilities for therapeutic exploitation.
Heat-shock protein 70 kDa (HSP70) is a chaperone that can facilitate tumor cell growth and is up-regulated in response to other protein homeostasis-targeted therapies, such as inhibitors of HSP90 and the proteasome (6, 7). Indeed, HSP70 induction likely lessens the therapeutic effects of such inhibitors (8). HSP70s maintain cellular homeostasis by binding misfolded polypeptides and, through a cycle of cochaperone-accelerated ATP hydrolysis, refold these clients, transfer them to HSP90, facilitate protein trafficking or posttranslational modifications, or target misfolded substrates for degradation (9). The human genome encodes 14 distinct HSP70 family members that have unique subcellular localizations, inducible or constitutive expression patterns, and/or activities. This specialization in function suggests that pharmacologic inhibition of HSP70 will provide a therapeutic window in certain cancer subsets. Recently discovered small molecule HSP70 inhibitors have shown some activity in select preclinical cancer models (10–14). The availability of these HSP70 inhibitors creates, for the first time, an opportunity to understand the role of this critical proteostasis factor in cancer subtypes.
Sarcomas are connective tissue tumors that comprise a substantial burden of pediatric cancer incidence and mortality (15). A subset of pediatric sarcomas is driven by fusion oncogenes. Rhabdomyosarcoma (RMS), the most common soft tissue sarcoma affecting children and young adults, provides a compelling case for targeting fusion oncoproteins in these connective tissue malignancies. Although overall survival for children with RMS approaches 70%, the presence of the paired box 3-forkhead box O1 (PAX3-FOXO1) fusion strongly associates with adverse outcome predictors such as an extremity primary site and metastatic disease at diagnosis (16). Despite 30 y of clinical trials, PAX3-FOXO1 fusion-positive RMS patients with metastatic disease are considered incurable with current therapies (17). Difficulties in directly inhibiting the PAX3-FOXO1 transcription factor chimera and a largely unaltered genomic landscape in RMS have, to date, precluded precision medicine in this disease (18, 19). To test whether HSP70 represents an alternative therapeutic target in RMS, we explored the hypothesis that HSP70 is essential for RMS cell survival, either through stabilizing the PAX3-FOXO1 fusion protein or another function.
Results
HSP70 Function Is Essential for RMS Cell Viability.
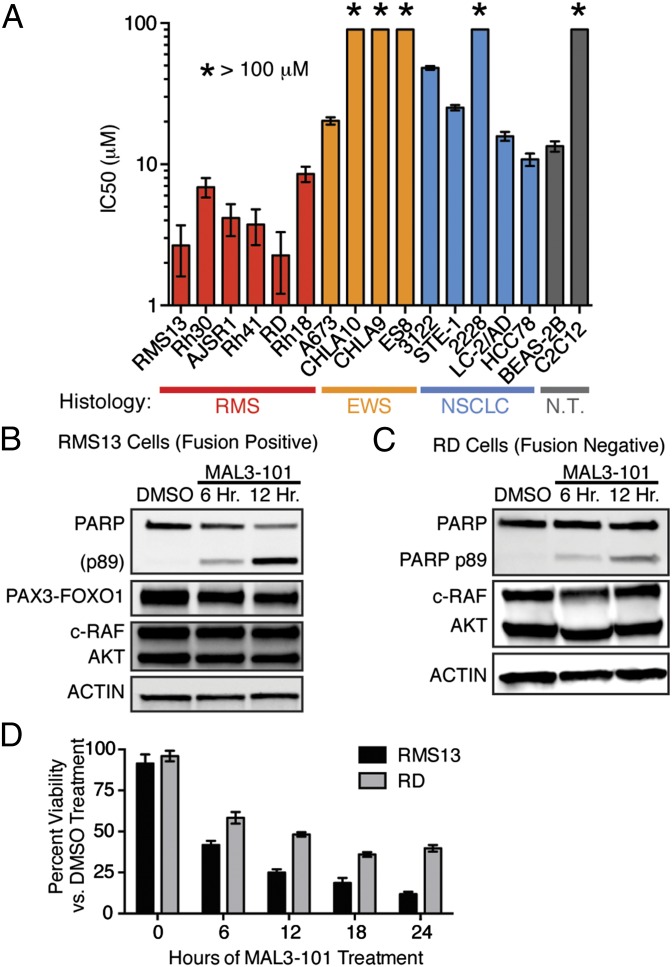
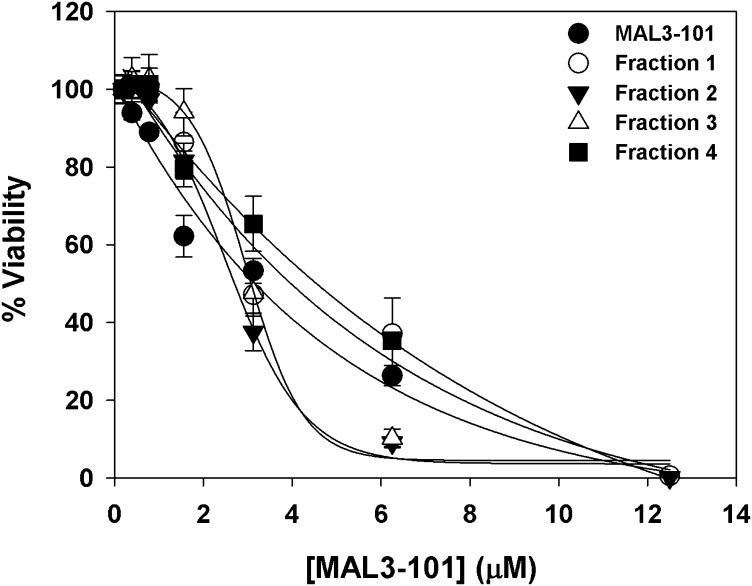
We used the tool compound MAL3-101 (20) to assess whether HSP70 chaperone function is required for survival in a panel of patient-derived, fusion-driven solid cancer models (Table S1). MAL3-101 is a specific HSP70 inhibitor that binds to an allosteric site within the chaperone’s ATPase domain, thus inhibiting catalytic activation by J domain-containing HSP40 chaperones (21). We found that different fusion-driven cancer models were not uniformly sensitive to inhibition of HSP70 activity but rather that RMS cell lines exhibited a unique MAL3-101 sensitivity (Fig. 1A). Furthermore, the PAX3-FOXO1–negative RMS cell lines RD and Rh18 were also quite sensitive to MAL3-101 (Fig. 1A). Because MAL3-101 is a mixture of four stereoisomers, we also tested the toxicity of the isomers individually but found them to be comparable to the mixture (Fig. S1). The data reveal a unique dependence upon HSP70 activity for RMS cell growth and show that the growth-suppressive effects of inhibiting HSP70 activity are independent of the presence of PAX3-FOXO1.
Table S1.
Summary of cell lines screened against the HSP70 inhibitor MAL3-101
| Cell line | Histology | Driver fusion |
| RMS13 | RMS | PAX3-FOXO1 |
| Rh30 | RMS | PAX3-FOXO1 |
| AJSR1 | RMS | PAX3-FOXO1 |
| Rh41 | RMS | PAX3-FOXO1 |
| RD | RMS | None |
| Rh18 | RMS | None |
| A573 | Ewing sarcoma | EWS-FLI1 |
| CHLA10 | Ewing sarcoma | EWS-FLI1 |
| CHLA9 | Ewing sarcoma | EWS-FLI1 |
| ES8 | Ewing sarcoma | EWS-FLI1 |
| H3122 | Nonsmall cell lung cancer | EML4-ALK |
| STE-1 | Nonsmall cell lung cancer | EML4-ALK |
| H2228 | Nonsmall cell lung cancer | EML4-ALK |
| LC-2/AD | Nonsmall cell lung cancer | CCDC6-RET |
| HCC78 | Nonsmall cell lung cancer | SLC34A2-ROS1 |
| BEAS-2B | Bronchial epithelium | None |
| C2C12 | Murine myoblast | None |
Fig. 1.
Human RMS cell survival depends upon HSP70 activation. (A) Cell lines were seeded in 96-well plates and treated with increasing MAL3-101, an inhibitor of HSP70 cochaperone activation. Viability at 72 h was measured using a CellTiter-Glo assay; IC50 doses were calculated using nonlinear regression. Data are shown as mean ± SEM (n = 3). (B and C) RMS13 (B) and RD (C) cells were treated with 10 μM MAL3-101 for the indicated times, and whole-cell lysates were blotted for PARP cleavage, PAX3-FOXO1, c-RAF, AKT, and β-actin. Data represent three independent experiments. (D) RMS13 and RD cells were treated with 10 μM MAL3-101 or DMSO, and numbers of viable cells were counted by trypan blue exclusion at the indicated times. The mean percentage (± SEM) of viable cells compared with DMSO is shown (n = 6).
Fig. S1.
Toxicity of MAL3-101 and four MAL3-101 stereoisomers in RMS13 rhabdomyosarcoma cells. Stereoisomers were prepared as described in the SI Methods. Cells were incubated with either stereoisomers or MAL3-101 at the indicated concentrations for 72 h and viability was assayed with CellTiter-Glo. Data represent the means of three independent experiments ± SD. Stereoisomer 1 (Fraction 1): tR 23.3 min; Stereoisomer 2 (Fraction 2): tR 25.3 min; Stereoisomer 3 (Fraction 3): tR 29.3 min; Stereoisomer 4 (Fraction 4): tR 32.0 min (ChiralPak IA); Stereoisomers 1 and 4 as well as Stereoisomers 2 and 3 are enantiomeric pairs.
In support of this notion, immunoblots of PAX3-FOXO1–positive RMS13 cells treated with MAL3-101 showed rapid induction of apoptosis, without substantial concurrent degradation of the PAX3-FOXO1 protein (Fig. 1 B and D). We independently confirmed that the growth suppression and apoptosis induced by MAL3-101 extended to PAX3-FOXO1 fusion–negative RD cells (Fig. 1 C and D). Prior work has shown that HSP70 may stabilize C-RAF and AKT (22), thus sustaining survival signaling through the MAP kinase and PI3-kinase pathways. However, we found no evidence of substantial degradation of these proteins in the time course during which MAL3-101 induces apoptosis in RMS13 or RD cells (Fig. 1 B–D). Based on these results, we hypothesized that inhibiting HSP70 activation with MAL3-101 led to RMS cell death, not via the loss of well-documented cancer-survival signals such as PAX3-FOXO1, MAPK, or PI3K, but instead through collapse of a critical proteostasis network that is essential for RMS cell survival.
HSP70 Inhibition Activates the Unfolded Protein Response in RMS Cells.
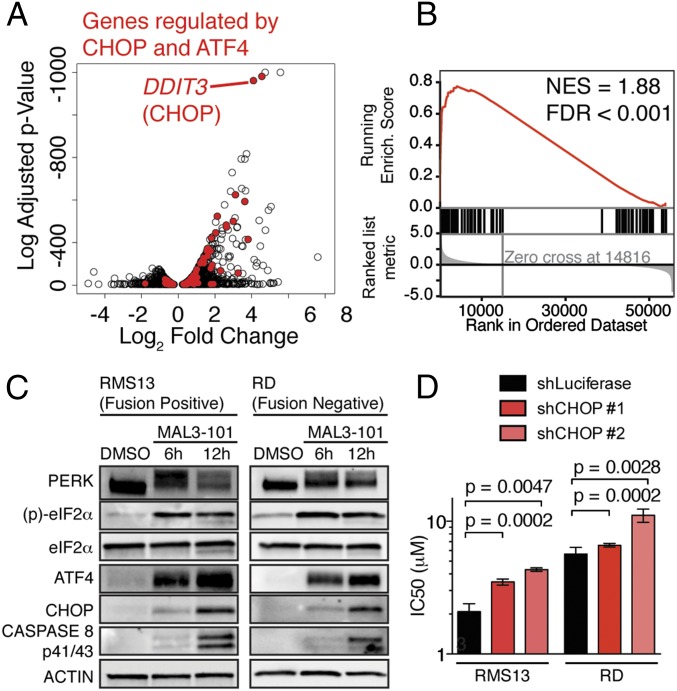
We next used an unbiased approach to identify the basis of the lethal effects of HSP70 inhibition by MAL3-101 in RMS cells. Perturbation of chaperone components can cause profound and specific changes in gene expression that dictate the cellular response to chaperone modulation (23). As such, we reasoned that transcriptome analysis might reveal a specific cellular program that is engaged by MAL3-101 treatment to cause RMS cell death. We found that DNA damage inducible transcript 3 (DDIT3), the gene encoding CEBP homologous protein (CHOP), was among the most strongly up-regulated genes following MAL3-101 treatment (Fig. 2A). Because CHOP has been associated with apoptosis downstream of the accumulation of unfolded proteins in the endoplasmic reticulum (ER) (24), our finding raised the possibility that HSP70 inhibition engages the unfolded protein response (UPR) and induces CHOP to kill RMS cells.
Fig. 2.
HSP70 inhibition triggers the UPR and engages CHOP to promote RMS apoptosis. (A) Genes regulated by 9-h MAL3-101 versus DMSO treatment in RMS13 cells. The log2 fold-change is plotted against the log10-adjusted P value (Benjamini–Hochberg correction). Genes regulated by CHOP and ATF4 in mouse embryonic fibroblasts after tunicamycin (29) are highlighted in red, and CHOP (DDIT3) is indicated. (B) GSEA of the genes highlighted in A. NES, normalized enrichment score; FDR, false-discovery rate. (C) Immunoblots from RMS13 and RD cells treated with 10 μM MAL3-101, representing three independent experiments. Lysates were run on the same gel as in Fig. 1B, so the loading control is repeated. (D) RMS13 and RD cells were transduced with shRNAs against luciferase (control) or DDIT3 (CHOP). The IC50 was measured as in Fig. 1A. Bar plots show mean ± SEM; P values were calculated by unpaired t test (n = 6–9).
The UPR is a conserved network of signaling pathways that permit either an adaptive survival or apoptotic response to misfolded proteins in the ER (25). Three distinct UPR sensors, PRKR-like endoplasmic reticulum kinase (PERK), inositol-requiring enzyme 1 (IRE1), and activating transcription factor 6 (ATF6), have different transcriptional outputs in mammalian cells. PERK activation enhances transcription and translation of both activating transcription factor 4 (ATF4) and CHOP (25). Both Ingenuity Pathway Analysis (26) and gene set enrichment analysis (GSEA) (27, 28) of the gene expression changes induced by MAL3-101 treatment showed strong enrichment for genes that are direct targets of the CHOP and ATF4 transcription factors (Fig. 2 A and B and Table S2) (29). Further, we found that HSP70 inhibition with MAL3-101 biochemically engaged the PERK–eukaryotic translation initiation factor α (eIF2α)–CHOP signaling axis in RMS cells, as shown by electrophoretic mobility shift of PERK (consistent with phosphorylation and activation), phosphorylation of the PERK target eIF2α, and induction of ATF4 and CHOP in both PAX3-FOXO1–positive and PAX3-FOXO1–negative RMS cell lines (Fig. 2C). Additionally, we observed proteolytic cleavage and activation of caspase 8, consistent with recent reports indicating that caspase 8 promotes cell death downstream of CHOP (30).
Table S2.
Top regulators of transcriptional networks after MAL3-101 treatment as predicted by Ingenuity Pathway Analysis
| Regulator | Description | Activation z-score | P value |
| EIF2AK3 | PERK | 3.501 | 3.51E-04 |
| Valproic acid | Antiepileptic medication | 5.697 | 7.24E-04 |
| PKCs | Protein kinase C signaling | 2.356 | 1.11E-03 |
| Lactacystin | Protease inhibitor | 2.432 | 2.82E-03 |
| miR-291a-3p | Mature microRNA with seed AAGUGCU | −4.563 | 3.32E-03 |
| Lipopolysaccharide | Bacterial cell wall component | 5.277 | 3.89E-03 |
| XBP1 | Effector of IRE1 signaling | 6.754 | 5.29E-03 |
| ATF4 | Effector of PERK signaling | 6.065 | 7.89E-03 |
| miR-181a-5p | Mature microRNA with seed ACAUUCA | −7.936 | 9.96E-03 |
| A23187 | Divalent cation binder | 3.796 | 1.02E-02 |
Inhibition of HSP70 Leads to CHOP-Dependent Apoptosis.
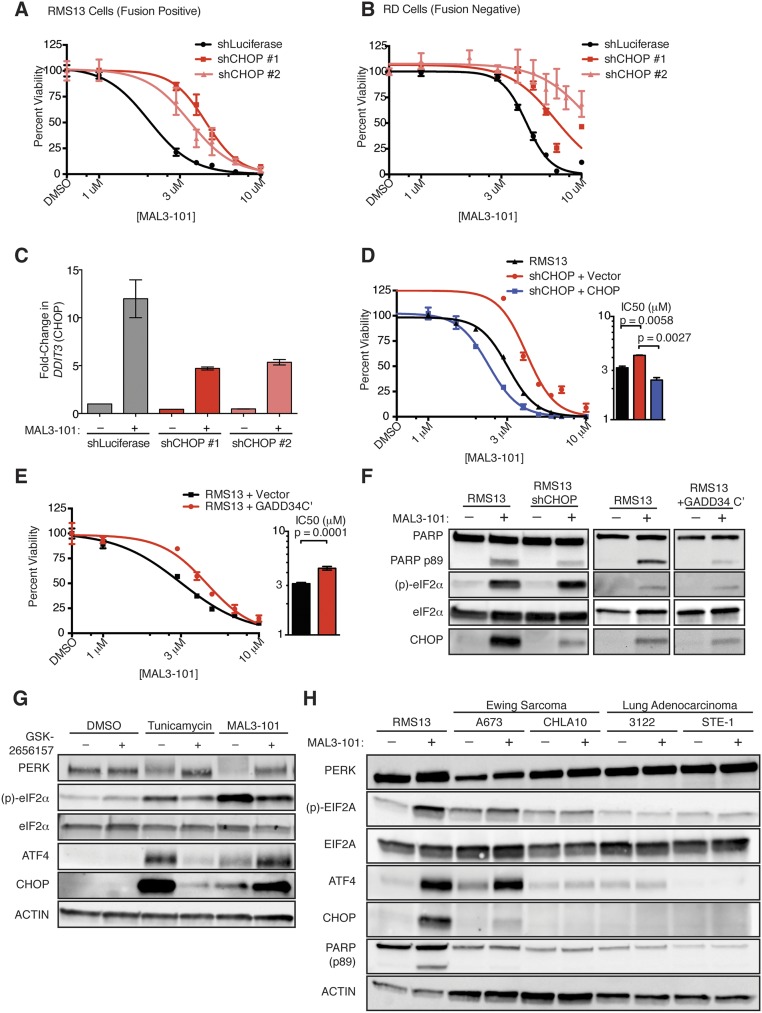
To test the importance of CHOP in inducing MAL3-101–dependent apoptosis, we used shRNAs to knock down DDIT3 (CHOP) in fusion-positive RMS13 cells and fusion-negative RD cells. In both these systems, CHOP knockdown promoted MAL3-101 resistance (Fig. 2D and Fig. S2 A–C), suggesting that CHOP is required for cell death induced by MAL3-101 treatment. Consistent with these findings, CHOP overexpression partially reversed the effects of shRNA-mediated CHOP knockdown (Fig. S2D). This observation suggests that off-target shRNA effects are unlikely to explain the CHOP knockdown phenotype and that increased CHOP sensitizes RMS cells to HSP70 inhibition.
Fig. S2.
CHOP is necessary for MAL3-101–induced apoptosis in both PAX3-FOXO1–positive and PAX3-FOXO1–negative RMS cells. (A and B) PAX3-FOXO1–positive RMS13 cells (A) and PAX3-FOXO1–negative RD cells (B) were transduced with shRNAs against luciferase (control) or DDIT3 (CHOP). MAL3-101 IC50 was measured after 72 h by CellTiter-Glo. (C) RMS13 cells were transduced with shRNAs targeting luciferase or CHOP, then treated with 10 μM MAL3-101 or DMSO for 6 h. Total RNA was harvested, and qPCR was used to measure fold-change in CHOP induction, normalized to GAPDH. Error bars show SEM; n = 3. (D) RMS13 cells previously transduced with shRNA against DDIT3 were transduced with CHOP cDNA or empty vector, and the IC50 was measured as in A. P values were calculated by unpaired t test (n = 3). (E) RMS13 cells were transduced with the GADD34 C terminus, a negative regulator of CHOP (31), or empty vector, and the IC50 was measured as in C. (F) RMS13 cells transduced with shRNA against CHOP or a control shRNA against luciferase, or expressing the C’ terminus of long-tailed hamster GADD34, or containing an empty vector were treated with 10 μM MAL3-101 for 6 h. Immunoblots show that decrements in CHOP induction correlate with diminished PARP cleavage. (G) RMS13 cells were pretreated for 30 min with DMSO or 0.1 μM GSK2656157, a PERK inhibitor, and then with either 10 μM MAL3-101 or 1 μg/mL tunicamycin for 6 h. Whole-cell lysates were used to measure whether pretreatment blocked ATF4 and CHOP induction. (H) Lysates from MAL3-101–sensitive RMS13 cells and MAL3-101–resistant A673, CHLA10 (EWS-FLI1+, Ewing sarcoma), H3122, and STE-1 (EML4-ALK+, nonsmall cell lung cancer) cells treated with 10 μM MAL3-101 or DMSO for 8 h. Resistant cells either completely fail to activate the UPR in response to drug or selectively activate the adaptive ATF4 arm with minimal CHOP induction and apoptosis. Blots are representative of three independent experiments.
As an independent means to assess the role of CHOP after MAL3-101 treatment, we confirmed that overexpression of the C terminus of Chinese hamster GADD34 (31), a catalytic phosphatase subunit that dephosphorylates eIF2α and suppresses CHOP, similarly promoted MAL3-101 resistance (Fig. S2E). The degree of CHOP suppression achieved by these genetic manipulations correlated with the amount of poly(ADP-ribose) polymerase (PARP) cleavage observed upon MAL3-101 treatment; namely, decreased CHOP was associated with less PARP cleavage (Fig. S2F). Pharmacologic inhibition of the UPR sensor PERK (32) did not block CHOP induction after MAL3-101 treatment, despite blocking both PERK autophosphorylation and CHOP induction after the addition of tunicamycin (Fig. S2G). These data highlight the known functional redundancy among eIF2α kinases (33). Finally, cancer cell lines that were MAL3-101 resistant either had insufficient UPR activation to induce CHOP or failed to activate the UPR after MAL3-101 treatment (Fig. S2H). These collective data indicate that CHOP induction is necessary for MAL3-101–induced apoptosis.
Cytosolic HSP70s Are the Essential Targets of MAL3-101.
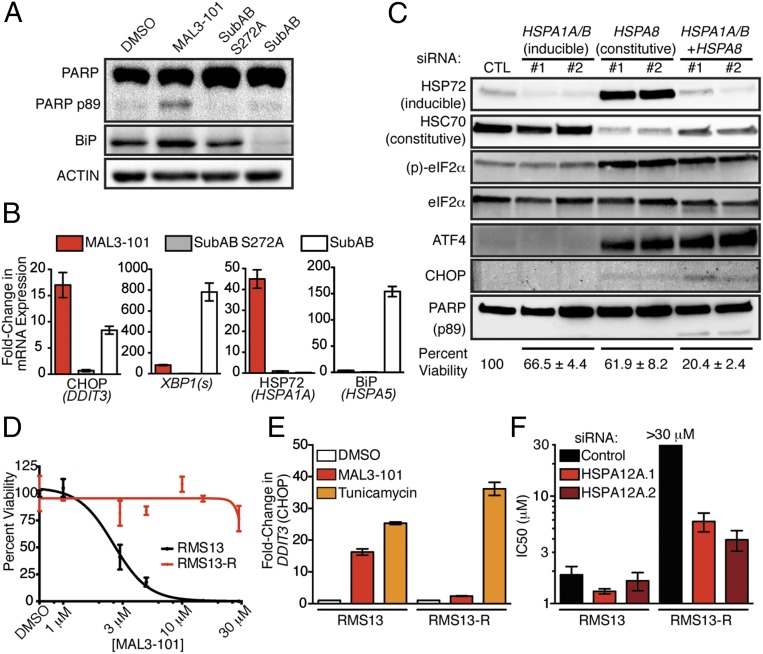
We next asked whether toxic activation of the UPR by MAL3-101 was caused by inhibition of a specific HSP70 isoform. Because misfolded peptides in the ER lumen canonically activate ER-resident UPR sensors such as PERK, we reasoned that loss of the ER-localized HSP70, binding protein (BiP), would be sufficient to reproduce the drug’s effects. To address this hypothesis, we treated RMS13 cells with the subtilase cytotoxin (SubAB), which proteolytically cleaves BiP and thereby abrogates its function (34), and asked whether this treatment recapitulates the biochemical and transcriptional effects of MAL3-101. To our surprise, SubAB did not induce apoptosis as measured by PARP cleavage within the same time course as MAL3-101 (Fig. 3A). Further, SubAB induced CHOP mRNA to only half the level of MAL3-101 despite complete clearance of BiP protein from the SubAB-treated cells (Fig. 3 A and B). By contrast, SubAB more strongly activated the UPR sensor IRE1 as indicated by dramatically higher splicing of XBP1 in cells treated with SubAB than in cells treated with MAL3-101 (Fig. 3B). Finally, although inhibition of BiP with SubAB toxin induced a compensatory up-regulation of BiP mRNA (HSPA5), MAL3-101 instead provoked strong up-regulation of HSPA1A, which encodes the cytosolic chaperone HSP72 (Fig. 3B). Thus, inhibition of the ER-resident HSP70 isoform BiP leads to a transcriptional program and cell fate distinct from that seen with MAL3-101 treatment.
Fig. 3.
Cytosolic HSP70 is required for RMS survival. (A) RMS13 cells were treated with DMSO, 10 μM MAL3-101, 125 ng/mL catalytically inactive subtilase cytotoxin (SubAB S272A), or 125 ng/mL active toxin (SubAB) for 6 h. Whole-cell lysates were used to detect PARP cleavage and BiP levels. Data shown represent three independent experiments. (B) RNA was extracted from RMS13 cells for qPCR as in A. Gene expression was normalized to GAPDH; data show mean ± SD (n = 3). (C) RMS13 cells were transfected with the indicated siRNAs for 72 h. Immunoblots confirmed knockdown and measured UPR activation. Data shown are representative of three independent experiments. Cell viability 120 h after transfection was measured by CellTiter-Glo and normalized to cells transfected with a control siRNA. Mean viability ± SEM from two siRNAs per gene are shown below blots (n = 4). (D) Dose–response of the isogenic RMS13-R cell line and parental RMS13 cells to MAL3-101. (E) RMS13 and RMS13-R cells were treated with 10 μM MAL3-101 or 5 μg/mL tunicamycin for 6 h. CHOP induction was measured by qPCR. Data are shown as mean fold-change ± SEM. (F) RMS13 and RMS13-R cells were transfected with siRNA as indicated and then were treated with MAL3-101; viability was measured using CellTiter-Glo. IC50 doses were calculated by nonlinear regression. IC50 for RMS13-R cells treated with control siRNA was not reached at the highest dose tested (30 μM). Mean IC50 (± SEM) from three independent replicates is shown.
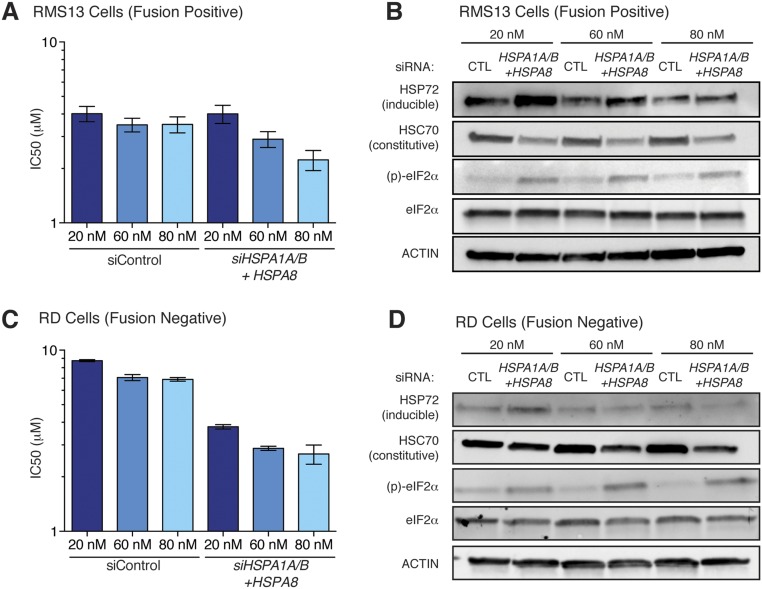
Based on the induction of HSP72 that we observed upon MAL3-101 treatment (Fig. 3B), we hypothesized that MAL3-101 predominantly targets a cytosolic chaperone (35). To test this hypothesis, we used a genetic approach. We found that knockdown of the inducible cytosolic chaperone HSP72 (encoded by HSPA1A and HSPA1B) had little effect on either UPR activation or cell viability (Fig. 3C). Knockdown of the major constitutively expressed cytosolic HSP70, HSC70 (HSPA8), produced strong eIF2α phosphorylation and ATF4 induction but minimal CHOP induction and only a minor loss of cell viability (Fig. 3C). This effect was accompanied by up-regulation of the stress-inducible HSP72 isoform (Fig. 3C). We reasoned that this compensatory induction of HSP72 provides sufficient chaperone activity to rescue cells from full commitment to UPR-mediated death. Therefore, we knocked down HSP72 (HSPA1A and HSPA1B) and HSC70 (HSPA8) concomitantly and found that combined knockdown of the inducible and constitutive forms of cytosolic HSP70 provoked robust UPR activation accompanied by PARP cleavage and loss of RMS cell viability (Fig. 3C). Additionally, simultaneous knockdown of HSP72 and HSC70 sensitized both fusion-positive and fusion-negative RMS cells to MAL3-101 (Fig. S3), as was consistent with depletion of the relevant drug target(s).
Fig. S3.
Inducible and constitutive cytosolic HSP70s are the relevant targets of MAL3-101 in RMS cells. (A and C) Fusion-positive RMS13 (A) or fusion-negative RD (C) cells were transfected with the indicated concentrations of control siRNA or pools of siRNA targeting HSPA1A/B (inducible) and HSPA8 (constitutive) for 72 h and then were treated with MAL3-101. Viability was measured 48 h later by CellTiter-Glo, and IC50 doses were calculated by nonlinear regression. Data shown are from three independent replicates; error bars represent the SEM. (B and D) Immunoblots of cells treated as in A and C demonstrate increasing knockdown with increasing amounts of siRNA. Note that at low concentrations of siRNA, compensatory up-regulation of HSPA1A/B results in more HSP72 (inducible), as in Fig. 3C.
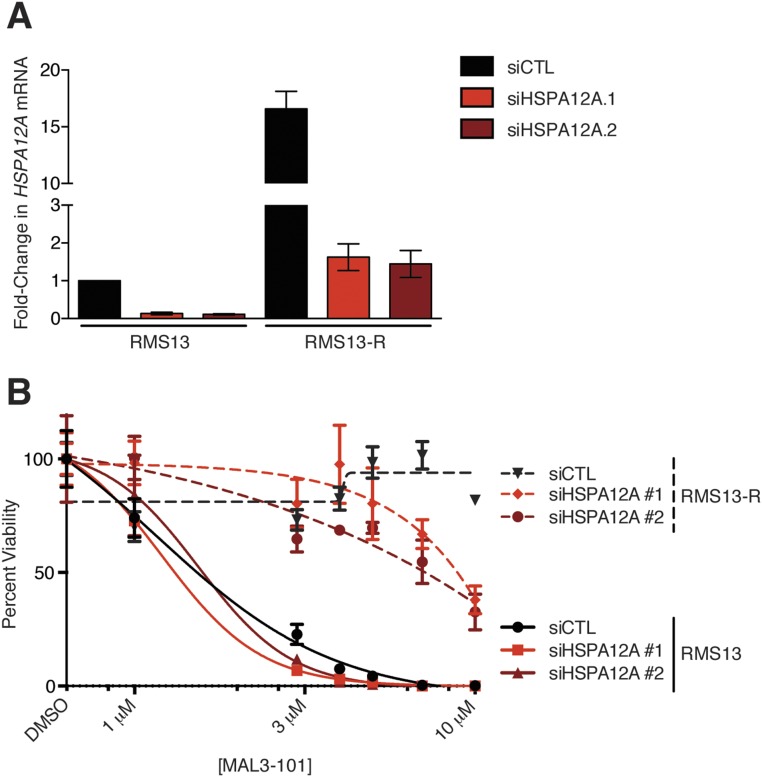
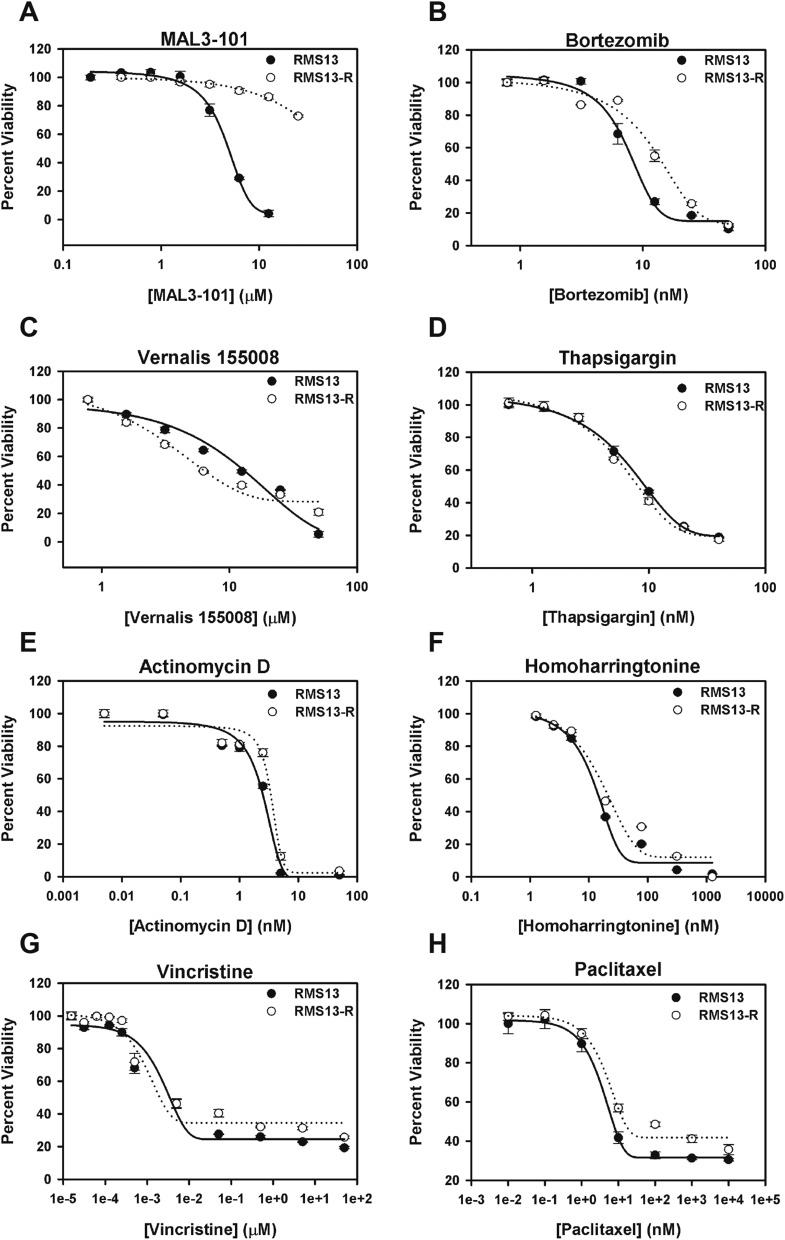
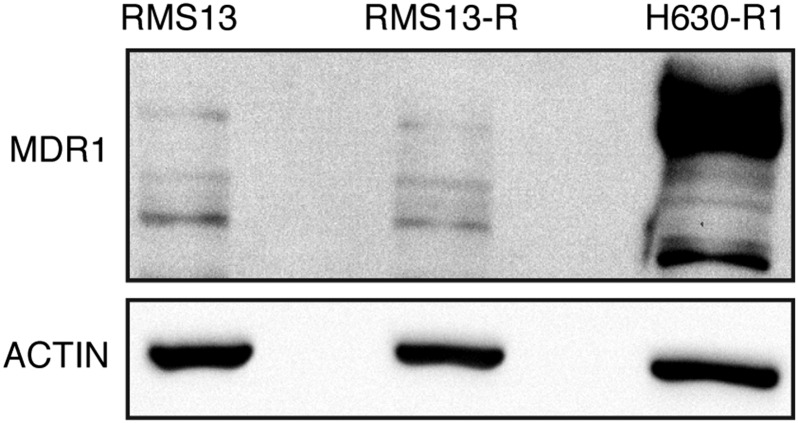
As an alternative approach to identify the relevant target of MAL3-101 in RMS cells, we grew RMS13 cells under a steady dose escalation of the compound and clonally derived resistant (RMS13-R) populations. The isolated MAL3-101–resistant RMS13-R cell line tolerated up to 30 µM MAL3-101 without loss of viability (Fig. 3D). Although RMS13-R cells activated the UPR appropriately after treatment with tunicamycin, CHOP induction was absent after MAL3-101 treatment, suggesting a resistance mechanism that prevented UPR activation (Fig. 3E). Whole-exome and transcriptome sequencing of RMS13-R cells failed to identify point mutations or copy number alterations in the HSP70 family members, PERK, eIF2α, or CHOP that could explain resistance but instead demonstrated significantly increased expression (but not mutation or genomic amplification) of a distinct cytosolic HSP70, heat shock protein family A member 12A (HSPA12A) (Table S3). We hypothesized that up-regulation of HSPA12A might promote resistance to MAL3-101 by increasing the abundance of a relevant drug target (i.e., an alternate cytosolic HSP70 protein). As predicted, silencing HSPA12A expression in RMS13-R cells resulted in partial restoration of MAL3-101 sensitivity (Fig. 3F and Fig. S4). Notably, these RMS13-R cells remained sensitive to a wide range of other therapeutic agents (Fig. S5) and did not up-regulate multidrug-resistance transporters (Fig. S6). These results strongly suggest that the mechanism underlying MAL3-101 resistance is inhibitor specific. Together, our data establish cytosolic HSP70 function as essential for RMS cell survival and show that MAL3-101 blocks cytosolic HSP70s to activate lethal PERK–eIF2α–CHOP signaling.
Table S3.
Top genes up-regulated in RMS13-R cells compared with parental RMS13 cells
| Symbol | Gene | Mean τ per million | Log2 fold-change | |
| RMS13 | RMS13-R | |||
| PTGIS | Prostaglandin I2 synthase | 34.7 | 2,085.5 | 5.91 |
| HSPA12A | Heat shock protein 70 kDa protein 12A | 37.2 | 1,338.3 | 5.17 |
| C20orf166-AS1 | C20orf166 Antisense RNA 1 | 851.1 | 16,962.6 | 4.32 |
| EPHA4 | EPH receptor A4 | 208.6 | 2,443.3 | 3.55 |
| COL3A1 | Collagen, type III, α1 | 1,304.7 | 11,999.1 | 3.20 |
| LMO7 | LIM domain 7 | 2,441.9 | 8,771.2 | 1.84 |
| IGF2 | Insulin-like growth factor 2 | 134,725.7 | 461,563.8 | 1.78 |
| MME | Membrane metallo-endopeptidase | 2,173.9 | 7,249.9 | 1.74 |
| COL5A2 | Collagen, type V, α2 | 20,127.8 | 65,012.8 | 1.69 |
| CKAP4 | Cytoskeleton-associated protein 4 | 2,922.1 | 9,356.2 | 1.68 |
Fig. S4.
Knockdown of HSPA12A restores MAL3-101 sensitivity to RMS13-R cells. (A) Parental RMS13 and resistant RMS13-R cells were transfected with siRNA as indicated, and the change in HSPA12A transcript was measured by qPCR (data show mean fold-change ± SEM). The difference between RMS13 treated with control siRNA (siCTL) and RMS13-R treated with either siRNA targeting HSPA12A was not significant by two-tailed t test (P = 0.13 for siRNA #1 and 0.26 for siRNA #2). (B) RMS13 and RMS13-R lines transfected with siRNAs as in A were treated with increasing amounts of MAL3-101, and viability was measured using CellTiter-Glo. Error bars show SEM from three independent replicates.
Fig. S5.
RMS13-R cells remain sensitive to a diverse spectrum of cytotoxic compounds. RMS13 and RMS13-R cells were seeded into 96-well plates and treated for 72 h with (A) MAL3-101, (B) bortezomib, (C) Vernalis 155008, (D) thapsigargin, (E) actinomycin D, (F) homoharringtonine, (G) vincristine, or (H) paclitaxel, representing inhibitors of different nodes of the proteostasis networks and conventional chemotherapeutic agents active in RMS. Viability was measured by CellTiter-Glo. The data shown represent the means of three independent experiments.
Fig. S6.
RMS13-R cells do not up-regulate a multidrug resistance transporter. RMS13 and RMS13-R cells were lysed, and immunoblots were probed for abundance of the p-glycoprotein (MDR1) channel. H630R1 cells are shown as a positive control. The blot shown is representative of three independent replicates.
Conventional Chemotherapy Is Insufficient to Activate CHOP in RMS.
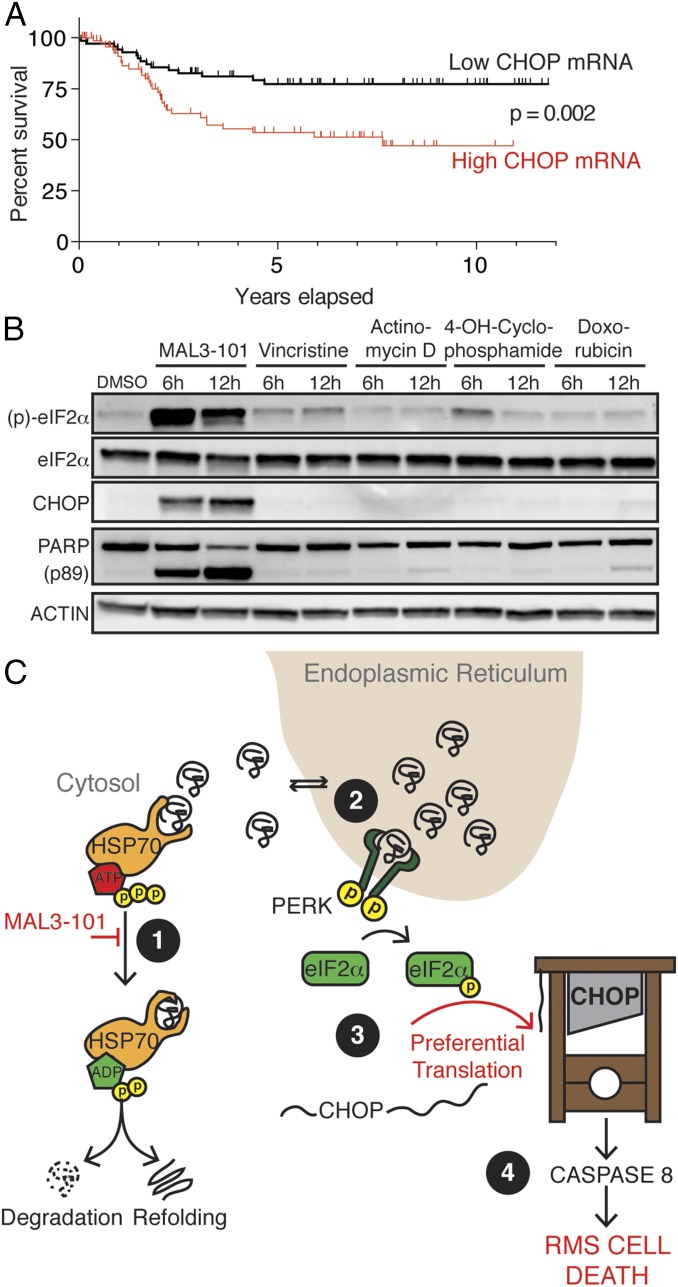
We next sought to understand the clinical significance of CHOP expression in RMS patients. Interestingly, we found by analysis of an available mRNA profiling dataset that increased CHOP mRNA predicted decreased survival in RMS patients treated with conventional chemotherapy (Fig. 4A) (36). Consistent with this finding is the observation that genomic amplification of the 12q13-14 band containing CHOP (DDIT3), which likely increases CHOP mRNA expression, is associated with decreased event-free survival in fusion-positive RMS patients (37). This paradox—i.e., CHOP-dependent cancer cell death in cell lines but more aggressive cancer with high CHOP mRNA in clinical specimens—may be explained by the translational regulation of CHOP. Translation of full-length, functional CHOP proceeds from an internal ORF only upon phosphorylation of eIF2α (38), as occurs in response to HSP70 inhibition (Fig. 2C). Therefore, we hypothesized that conventional chemotherapy, unlike HSP70-targeted therapy, is insufficient to induce the translation of full-length CHOP in RMS cells despite high levels of CHOP mRNA. In support of this hypothesis, we found that the chemotherapeutic agents used in RMS patients were unable to induce eIF2α phosphorylation and CHOP protein expression substantially within the timeframe in which HSP70 inhibition was able to do so (Fig. 4B). Based on our collective findings, we posit that CHOP up-regulation predicts poor clinical response to chemotherapy because conventional treatment does not trigger the induction of functional CHOP protein that supports apoptosis in RMS cells. However, increased CHOP instead may identify a population of patients whose tumors are primed to undergo apoptosis in response to HSP70-targeted therapy, as predicted by our preclinical findings. Thus, CHOP may serve as a dual biomarker. This scenario is similar to human epidermal growth factor receptor 2 (HER2) amplification in patients with breast cancer, in whom HER2 amplification predicts poor outcomes with conventional chemotherapy but superior outcomes with HER2-targeted therapy (39, 40). Consistent with this notion, CHOP promotes cell survival or death in a context-specific manner (24, 41). Overall, these findings reveal a potentially important dual and context-specific role for CHOP in RMS pathogenesis and identify CHOP as a promising biomarker to guide the clinical development of cytosolic HSP70 inhibitors to treat RMS patients.
Fig. 4.
Increased CHOP is a biomarker of poor survival in RMS patients after chemotherapy. (A) 120 RMS samples were divided by median expression of DDIT3 (CHOP) from Affymetrix U133A microarrays (36). P value for survival was calculated by log-rank test. (B) Immunoblot of RMS13 cells treated with 10 μM MAL3-101, 5 nM vincristine, 5 nM actinomycin D, 5 μg/mL 4-hydroperoxy-cyclophosphamide, or 1 μM doxorubicin for the indicated times. (C) A model for HSP70 dependence in RMS. Cytosolic HSP70s degrade or refold unfolded proteins (1) that back up in the ER after MAL3-101 treatment (2), thereby activating PERK to phosphorylate eIF2α (3). When CHOP mRNA is abundant, eIF2α phosphorylation leads to rapid translation of CHOP protein (4), activating a lethal program culminating in caspase 8 activation.
Discussion
We used a coordinated chemical–genetics strategy to reveal an unanticipated dependence of RMS cells on cytosolic HSP70, which we found acts to suppress UPR signaling from the ER and downstream CHOP engagement and apoptosis. This prosurvival role of HSP70 in RMS was independent of chaperone-mediated oncoprotein stabilization, supporting the application of our findings in both PAX3-FOXO1 fusion-positive and fusion-negative tumors. The central role of the CHOP transcription factor in this process highlights a potential biomarker for the efficacy of HSP70 inhibition. Our mechanistic insights also provide a new rationale for the therapeutic utility of HSP70-targeted therapy in RMS. Further development and optimization of MAL3-101 or a distinct cytosolic HSP70 inhibitor with favorable in vivo properties is necessary before preclinical testing and potential clinical translation of the therapeutic hypothesis arising from our work. Our findings provide strong motivation to pursue further pharmacologic development, because our data indicate that in vivo genetic studies would require successful knockdown of multiple constitutive and inducible forms of cytosolic HSP70 to represent pharmacologic modulation accurately. More broadly, our work provides a rationale for mapping proteostasis component coordination and function comprehensively in a cancer subtype-specific manner.
Our observation that inhibition of cytosolic HSP70 in RMS activates the UPR uncovers a connection between the function of this chaperone and the UPR. Although modest inhibition of the ER HSP70 chaperone BiP may contribute to the lethal effects of MAL3-101, our genetic data argue that loss of the cytosolic HSP70 chaperones is sufficient to activate UPR-mediated cell death. Precedent for such a connection has been established previously. For example, HSP70 inhibition might lead to the formation of cytosolic aggregates, and previous work demonstrated that poly-glutamine aggregates directly interfere with components of the ER-associated degradation (ERAD) pathway, which in turn induces the UPR (42). We also showed previously that perturbing cytosolic HSP70 disables ERAD and triggers the UPR, particularly when membrane-integrated, misfolded ER proteins must be cleared (43). Future studies will help elucidate the potential role of ERAD in connecting cytosolic HSP70 function to the UPR and CHOP induction in RMS cells.
We propose a model (Fig. 4C) whereby RMS-specific wiring of the proteostasis network links cytosolic HSP70 to CHOP through the UPR and is responsible for HSP70 inhibitor sensitivity in this disease. The specific factors underlying the dependence of RMS cells upon cytosolic HSP70 function remain to be identified. We propose two possibilities that are not necessarily mutually exclusive. First, the protein-translation program of RMS cells might include a significant number of HSP70 (and more specifically, ERAD) clients that accumulate upon cytosolic HSP70 inhibition, triggering the lethal UPR-inducible axis we uncovered. Future proteomic approaches may reveal clients whose clearance from the ER is blocked by HSP70 inhibition. Second, stress-sensing pathways and effectors (such as CHOP) in RMS cells might be hypersensitive to perturbations in proteostasis. Supporting this model is prior work implicating eIF2α–ATF4–CHOP signaling both in myogenesis, where CHOP may prevent terminal differentiation (44), and in sarcomagenesis (45). The duration of UPR signaling also has been linked to a bias toward apoptotic rather than adaptive (prosurvival) output (46), suggesting a mechanism by which myoblasts use CHOP in a regulated manner downstream of UPR engagement as a survival factor to establish pathogenicity and initiate RMS. However, sustained CHOP protein up-regulation in established RMS cells may then instead trigger an alternative fate, i.e., apoptosis in response to HSP70 inhibition. Because chemotherapy is insufficient to induce CHOP, HSP70 inhibition exploits an unanticipated vulnerability in this cancer.
In the era of precision medicine, the identification of driver mutations has yielded significant advances in the treatment of certain cancers (47). Unfortunately, progress in many other cancers, including RMS, has lagged. Our discovery of HSP70 dependence in RMS demonstrates that using chemical–genetic approaches to decipher and target the key and specific supportive networks that particular cancer cell types use to compensate for the stresses of oncogenic transformation—the so-called “non-oncogene dependence networks”—can provide novel, biomarker-driven therapeutic strategies to improve survival in patients in whom direct oncoprotein inhibition is not currently possible (48).
Methods
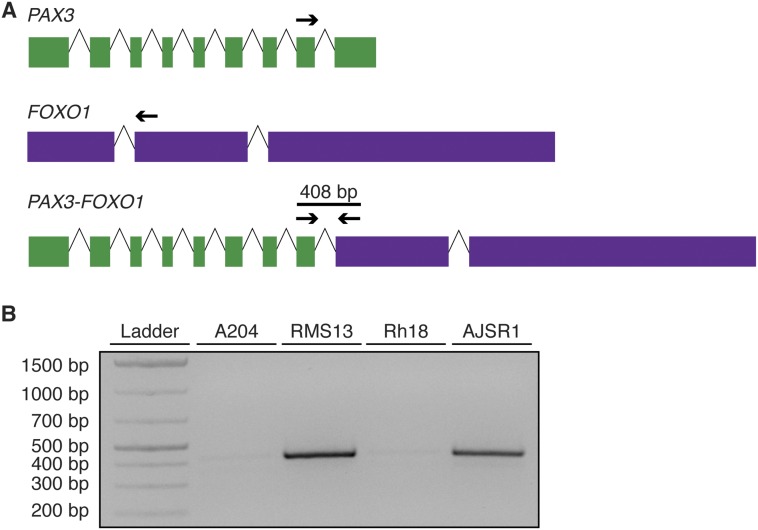
Cell lines are described in SI Methods. AJSR1 cells were grown from a marrow aspirate from the University of California, San Francisco (UCSF) Pediatric Tissue Bank and PAX3-FOXO1 expression confirmed by RT-PCR (Fig. S7). Informed consent was obtained under a protocol reviewed by the UCSF Institutional Review Board (IRB Approval 11-05192). MAL3-101 was dissolved in DMSO to 20 mM and stored at −80 °C. CellTiter-Glo (Promega) was used per the manufacturer’s instructions to measure cell viability. Antibodies for immunoblots are listed in SI Methods. RNA was extracted using RNeasy kits (Qiagen); quantitative PCR (qPCR) was performed as described (49) using primers as listed (Table S3); and transcriptome analysis was performed on an Illumina HiSEq. 2500 platform. Reads were aligned to hg19 using RSEM (50), and expression was calculated with DESeq. (51). The RMS13-R line was created by culturing RMS13 cells in escalating doses of MAL3-101 for 2 mo. Further details are given in SI Methods.
Fig. S7.
AJSR1 cells are PAX3-FOXO1–expressing RMS cells. (A) Schematic of RT-PCR primers that amplify chimeric PAX3-FOXO1 transcripts but not native PAX3 or FOXO1. Sequences are provided in Table S4. (B) RNA was extracted from the indicated cell lines (A204, malignant rhabdoid tumor, negative control; RMS13, alveolar RMS, positive control; Rh18, embryonal RMS; AJSR1, alveolar RMS). Reverse-transcriptase PCR was carried out on cDNA to detect the presence or absence of the chimeric transcript. The gel shown is representative of three independent replicates.
SI Methods
Cell Lines and Culture.
The following cell lines were purchased from ATCC: A204, RMS13, RD, C2C12, A673, H2228, and BEAS-2B. LC-2/AD cells were purchased from Sigma. Rh18, Rh30, Rh41, CHLA-9, and CHLA-10 cells were obtained from the Children’s Oncology Group Cell Culture and Xenograft Repository. STE-1 cells were a gift from Christine Lovly, Vanderbilt University, Nashville, TN. ES-8 cells were a gift from David Solomon, University of California, San Francisco. HCC78 cells were a gift from Jeff Engelman, Massachusetts General Hospital, Boston. H3122 cells were obtained from the NIH. AJSR1 cells were established using previously described techniques (49) from the bone marrow aspirate of a patient with metastatic alveolar RMS obtained from an institutional tissue banking protocol after informed consent was obtained. RT-PCR confirmed expression of the PAX3-FOXO1 oncogene in AJSR1 cells and the absence of PAX3-FOXO1 in Rh18 cells (Fig. S7).
All cells were cultured in incubators at 37 °C and 5% CO2 in RPMI-1640 supplemented with 10% (vol/vol) FBS and 1× penicillin/streptomycin with the exception of RMS13 cells [cultured in RPMI-1640 with 10% (vol/vol) FBS, 1× penicillin/streptomycin, 10 mM Hepes, 0.25% glucose, 1 mM sodium pyruvate], RD and C2C12 cells [cultured in DMEM with 10% (vol/vol) FBS and 1× penicillin/streptomycin], CHLA-9 cells [cultured in Iscove’s Modified Dulbecco’s Medium with 20% (vol/vol) FBS, 4 mM l-glutamine, 5 μg/mL insulin, 5 μg/mL transferrin, 5 ng/mL selenous acid, and 1× penicillin/streptomycin], and LC-2AD cells [cultured in 45% (vol/vol) RPMI-1640, 45% (vol/vol) F-12 Ham’s medium, 10% (vol/vol) FBS, and 1× penicillin/streptomycin]. Cells were regularly screened for mycoplasma infection using a luminescent assay (Lonza).
Viability Assays.
Cells were plated at a density of 8,000 cells/100 μL in 96-well clear-bottomed plates. After 72 h of drug treatment, the cells were lysed with CellTiter-Glo reagent (Promega), and luminescence was read on a SpectraMax M5 (Molecular Devices).
Immunoblotting.
Cells were plated at a density of 2 × 10⁵ in 2 mL medium per well in a six-well dish and allowed to adhere overnight before the indicated treatments. The supernatant was collected and washed with PBS. Adherent cells were washed with PBS and then lysed in radioimmunoprecipitation assay buffer [25 mM Tris⋅HCl (pH 7.6), 150 mM NaCl, 1% Nonidet P-40, 1% sodium deoxycholate, 0.1% SDS supplemented with protease inhibitors and phosphatase inhibitors (Roche Diagnostics)] and combined with pelleted cells from the supernatant. Lysates were clarified by sonication and centrifugation and were subjected to SDS/PAGE followed by blotting with indicated antibodies and detection via ECL Prime (GE Life Sciences) on an ImageQuant LAS 4000 (GE Life Sciences). For select antibody pairs (eIF2α/CHOP), detection was performed on an Odyssey imager (LI-COR Biosciences).
Antibodies were purchased as follows: from Cell Signaling Technologies: PARP (#9542), FOXO1 (#2880), c-RAF (#12552), AKT (#4691), PERK (#5683), (p)-eIF2α (#3398), eIF2α (#9722), ATF4 (#11815), CHOP (#2895), cleaved caspase 8 (#9496), BiP (#3177), HRP-conjugated anti-rabbit (#7704), and HRP-conjugated anti-mouse (#7706); from StressMarq Biosciences: HSC70 (SMC-151A) and HSP70 (SMC-113A); from Sigma-Aldrich: β-actin (#A2228); from LI-COR Biosciences: IRDye 680 anti-rabbit (#925-68023) and IRDye 800 anti-mouse (#925-32212); from Merck Millipore: anti–P-glycoprotein C219 (#517310).
Chemicals.
The stereoisomers of MAL3-101 were prepared as a mixture of diastereomers and enantiomers and then were separated by supercritical fluid chromatography (SFC) on a chiral stationary phase (CHIRALPAK IA). Purity (>95%) for each stereoisomer was determined by liquid chromatography (LC)-MS with evaporative light scattering (ELS) detection. Tunicamycin, thapsigargin, and actinomycin D were purchased from Sigma. VER-155008, paclitaxel, vincristine, and bortezomib were purchased from Selleckchem. Homoharringtonine was purchased from Santa Cruz Biotechnology. The use of the subtilase cytotoxin was previously described (34).
Deep Sequencing and Analysis.
A total of 1 × 10⁶ cells were plated and treated under the specified conditions. Either RNA or genomic DNA was extracted using RNeasy and DNeasy kits (Qiagen), respectively. Libraries for sequencing were prepared using TruSeq RNA Sample Preparation kits (Illumina) for transcriptome sequencing and SureSelect XT Human All Exon kits (Agilent) for exome sequencing and were sequenced using the HiSEq. 2500 platform at the Center for Advanced Technologies at the University of California, San Francisco. Reads were aligned against National Center for Biotechnology Information Build 37 (hg19) of the human genome with RSEM (50).
Differential expression of transcriptome data were performed with DESeq. (51). To identify genes differentially expressed in RMS13 cells after DMSO or MAL3-101 treatment, we performed Ingenuity Pathway Analysis (Qiagen) and GSEA using MSigDB (27) and a defined list of genes transcriptionally up-regulated by CHOP and ATF4 (29).
Viral Transduction of Cell Lines.
Lentiviral constructs with shRNAs against DDIT3 were purchased from Sigma and transduced into RMS13 or RD cells, which then were grown in 1 μg/mL puromycin (Gibco) for 72 h to select stable expressers. Knockdown was verified by qPCR and Western blot.
To rescue the effects of CHOP knockdown, RNA was extracted from RMS13 cells treated with MAL3-101 using an RNeasy kit (Qiagen) and synthesized into cDNA using a SensiFAST cDNA synthesis kit (Bioline). DDIT3 cDNA was PCR-amplified using the DDIT3-cDNA primers (Table S4) and Phusion Taq polymerase (New England Biolabs) and then was TA-cloned into a pCRII-TOPO vector (Life Technologies). The CHOP coding DNA sequence (CDS) was PCR-amplified from this vector using the CHOP_CDS primers (Table S4) to remove the terminal stop codon and was gel purified. The PCR product and pENTR1A plasmid (Life Technologies) were digested with XhoI and Not I and then ligated, and LR Clonase was used to recombine the CHOP CDS into pCDNA6.2/V5-DEST (Life Technologies) to create a V5-tagged CHOP construct. This expression vector and the pQCXIB retroviral vector (Addgene plasmid #17487), a gift from Eric Campeau, Zenith Epigenetics Corporation, Calgary, AB, Canada, were then digested with AgeI and NotI, gel purified, and ligated to create pQCXIB-CHOP-V5. RMS13 cells with stable expression of an shRNA targeting CHOP were then transduced with either pQCXIB or pQCXIB-CHOP-V5 and selected in 5 μg/mL blasticidin (Life Technologies) for 2 wk. Expression was confirmed by immunoblotting for V5.
Table S4.
Primers used for quantitative PCR and cloning
| Name | Sequence |
| Primers used for quantitative PCR | |
| CHOP-F | TTAAGTCTAAGGCACTGAGCGTATC |
| CHOP-R | TGCTTTCAGGTGTGGTGATG |
| HSPA1A-F | GGAGGCGGAGAAGTACA |
| HSPA1A-R | GCTGATGATGGGGTTACA |
| HSPA5-F | TTGTTCTTGTTGGTGGCTCG |
| HSPA5-R | CATCTGGGTTTATGCCACGG |
| XBP1-S-F | TGCTGAGTCCGCAGCAGGTG |
| XBP1-S-R | GCTGGCAGGCTCTGGGGAAG |
| GAPDH-F | TGCACCACCAACTGCTTAGC |
| GAPDH-R | GGCATGGACTGTGGTCATGAG |
| HSPA12A-F | GCTCCCACATCTGCATATTCAT |
| HSPA12A-R | TTCTGAGACGTTGGAGTCAGT |
| Primers used for cloning of DDIT3 | |
| DDIT3-cDNA-F | TAAAGATGAGCGGGTGGCAG |
| DDIT3-cDNA-R | GGGAAAGGTGGGTAGTGTGG |
| CHOP-CDS-F | TAGCATGCGGCCGCATGGCAGCTGAGTCATTGCC |
| CHOP-CDS-R | ATGCTACTCGAGCATGCTTGGTGCAGATTCACCA |
| Primers used for detection of PAX3-FOXO1 mRNA | |
| PAX3-5′ | GCACTGTACACCAAAGCACG |
| FOXO1-3′ | AACTGTGATCCAGGGCTGTC |
To test the effects of long-tailed hamster GADD34C-terminal expression on MAL3-101 sensitivity, RMS13 cells were transduced with retrovirus from either pBABE-puro (Addgene #1764), a gift from Harmut Land, University of Rochester, Rochester, NY, Jay Morgenstern, Warp Drive Bio, Cambridge, MA, and Bob Weinberg, Whitehead Institute for Biomedical Research, Cambridge, MA, or pBABE-GADD34C (Addgene #21813, published as haA1.pBABEpu), a gift from David Ron, Cambridge Institute for Medical Research, Cambridge, UK, and were selected with 1 μg/mL puromycin. Expression was confirmed by immunoblotting for p-eIF2α and CHOP.
siRNA Knockdown.
Cells were plated and allowed to adhere overnight. The following day, siRNAs purchased from Sigma or control siRNA (Thermo Scientific) were resuspended in serum-free medium with Lipofectamine 2000 (Life Technologies) at the indicated concentrations and then were pipetted onto cells after aspiration of normal growth medium. The siRNA-containing medium was replaced with regular growth medium after 6 h. Cells were harvested and plated for viability assays 48 h after transfection, and viability was measured after 48 h of the indicated drug treatments. qPCR or Western blotting to confirm knockdown was performed on cells plated in parallel at the conclusion of the experiment.
Clonal Derivation of Resistant Cells.
RMS13 cells were plated at 2 × 10⁵ cells per well in a six-well dish and then were treated with 500 nM MAL3-101. The medium was changed every 3 d, and the cells were split back to 2 × 10⁵ cells per well once they became confluent. After two splits at a given dosage of MAL3-101, the dose was progressively escalated as follows: 500 nM, 1 μM, 2 μM, 3 μM, 4 μM, 5 μM, 7.5 μM, and 10 μM. At that point, cells were expanded in 10 μM MAL3-101, trypsinized, and resuspended at 5 × 10³ cells per 30 mL medium in a 15-cm dish with 3 μM MAL3-101. After 2 wk, single-cell colonies were visible. These colonies were surrounded with autoclaved glass cloning cylinders (Sigma), trypsinized, and expanded. Resistance to MAL3-101 was reconfirmed using CellTiter-Glo assays, as described above.
qPCR.
A total of 2 × 10⁵ cells per well were plated in six-well dishes and allowed to adhere overnight. After the indicated treatments, RNA was extracted using an RNeasy kit (Qiagen), and cDNA was synthesized from 100 ng of starting RNA using a SensiFAST kit (Bioline). qPCRs were run on a QuantStudio 12k Flex thermocycler (Life Technologies) using Fast SYBR Green Master Mix (Life Technologies) and primers as described in Table S4. The PCR program was as follows: 95 °C for 10 min, then 40 cycles of 95 °C for 30 s, 55 °C for 30 s, and 72 °C for 45 s Each qPCR was run on three or more biologic replicates, with technical duplicates for each reaction. The efficiency of amplification was calculated on serial threefold dilutions of template primer in biologic duplicate; then relative gene expression was calculated as described (49), referencing GAPDH expression as an internal control.
Statistics.
IC50 concentrations from CellTiter-Glo experiments were calculated through nonlinear regression of luminescence normalized to the luminescence of DMSO-treated cells and medium alone using GraphPad Prism software (GraphPad Software, Inc.). GraphPad Prism was used to carry out a two-tailed Student’s t test to compare mean IC50 values in drug treatments, mean fold-change in gene expression in qPCR experiments, and mean tumor volume at the end of in vivo experiments. P values less than 0.05 were considered significant. Significance for differential expression in whole-transcriptome analysis was calculated using DESeq (51), which applies a Benjamini–Hochberg correction for multiple hypothesis testing. Significance of gene set enrichment was calculated by GSEA (27); a false-discovery rate of <5% was considered significant.
Acknowledgments
We thank the T.G.B. and J.L.B. laboratories for their input on experimental design and this manuscript; M. Kampmann, L. Gilbert, D. Acosta-Alvear, and the J.S.W. and P. Walter laboratories for advice and assistance in interpreting our results; and the P. Wipf laboratory for invaluable assistance in the purification and formulation of MAL3-101. This work was supported by a Howard Hughes Medical Institute Collaborative Innovation Award (to J.S.W., T.G.B., J.L.B., J.E.G., and P. Walter) and by NIH Grants GM75061 and DK079307 (to J.L.B.), DK101584 (to C.J.G.), and T32HD044331-10 (to A.J.S.). A.J.S. was also supported by St. Baldrick’s Foundation Fellowship A121893 and Damon Runyon-Sohn Foundation Fellowship 6P-13. The UCSF Pediatric Tissue Bank is supported by UCSF Cancer Center Grant P30 CA082103.
Footnotes
The authors declare no conflict of interest.
This article is a PNAS Direct Submission.
Data deposition: The RNA-sequencing data reported in this paper have been deposited in the Gene Expression Omnibus database (accession no. GSE80525).
This article contains supporting information online at www.pnas.org/lookup/suppl/doi:10.1073/pnas.1603883113/-/DCSupplemental.
References
- 1.Wang M, Kaufman RJ. The impact of the endoplasmic reticulum protein-folding environment on cancer development. Nat Rev Cancer. 2014;14(9):581–597. doi: 10.1038/nrc3800. [DOI] [PubMed] [Google Scholar]
- 2.Kim YE, Hipp MS, Bracher A, Hayer-Hartl M, Hartl FU. Molecular chaperone functions in protein folding and proteostasis. Annu Rev Biochem. 2013;82:323–355. doi: 10.1146/annurev-biochem-060208-092442. [DOI] [PubMed] [Google Scholar]
- 3.Dou QP, Zonder JA. Overview of proteasome inhibitor-based anti-cancer therapies: Perspective on bortezomib and second generation proteasome inhibitors versus future generation inhibitors of ubiquitin-proteasome system. Curr Cancer Drug Targets. 2014;14(6):517–536. doi: 10.2174/1568009614666140804154511. [DOI] [PMC free article] [PubMed] [Google Scholar]
- 4.Whitesell L, Santagata S, Lin NU. Inhibiting HSP90 to treat cancer: A strategy in evolution. Curr Mol Med. 2012;12(9):1108–1124. doi: 10.2174/156652412803306657. [DOI] [PubMed] [Google Scholar]
- 5.Chen D, Frezza M, Schmitt S, Kanwar J, Dou QP. Bortezomib as the first proteasome inhibitor anticancer drug: Current status and future perspectives. Curr Cancer Drug Targets. 2011;11(3):239–253. doi: 10.2174/156800911794519752. [DOI] [PMC free article] [PubMed] [Google Scholar]
- 6.Evans CG, Chang L, Gestwicki JE. Heat shock protein 70 (hsp70) as an emerging drug target. J Med Chem. 2010;53(12):4585–4602. doi: 10.1021/jm100054f. [DOI] [PMC free article] [PubMed] [Google Scholar]
- 7.Powers MV, et al. Targeting HSP70: The second potentially druggable heat shock protein and molecular chaperone? Cell Cycle. 2010;9(8):1542–1550. doi: 10.4161/cc.9.8.11204. [DOI] [PubMed] [Google Scholar]
- 8.Powers MV, Clarke PA, Workman P. Death by chaperone: HSP90, HSP70 or both? Cell Cycle. 2009;8(4):518–526. doi: 10.4161/cc.8.4.7583. [DOI] [PubMed] [Google Scholar]
- 9.Mayer MP, Bukau B. Hsp70 chaperones: Cellular functions and molecular mechanism. Cell Mol Life Sci. 2005;62(6):670–684. doi: 10.1007/s00018-004-4464-6. [DOI] [PMC free article] [PubMed] [Google Scholar]
- 10.Kang Y, et al. Heat shock protein 70 inhibitors. 1. 2,5′-thiodipyrimidine and 5-(phenylthio)pyrimidine acrylamides as irreversible binders to an allosteric site on heat shock protein 70. J Med Chem. 2014;57(4):1188–1207. doi: 10.1021/jm401551n. [DOI] [PMC free article] [PubMed] [Google Scholar]
- 11.Rodina A, et al. Affinity purification probes of potential use to investigate the endogenous Hsp70 interactome in cancer. ACS Chem Biol. 2014;9(8):1698–1705. doi: 10.1021/cb500256u. [DOI] [PMC free article] [PubMed] [Google Scholar]
- 12.Li X, et al. Validation of the Hsp70-Bag3 protein-protein interaction as a potential therapeutic target in cancer. Mol Cancer Ther. 2015;14(3):642–648. doi: 10.1158/1535-7163.MCT-14-0650. [DOI] [PMC free article] [PubMed] [Google Scholar]
- 13.Braunstein MJ, et al. Antimyeloma Effects of the Heat Shock Protein 70 Molecular Chaperone Inhibitor MAL3-101. J Oncol. 2011;2011:232037. doi: 10.1155/2011/232037. [DOI] [PMC free article] [PubMed] [Google Scholar]
- 14.Howe MK, et al. Identification of an allosteric small-molecule inhibitor selective for the inducible form of heat shock protein 70. Chem Biol. 2014;21(12):1648–1659. doi: 10.1016/j.chembiol.2014.10.016. [DOI] [PMC free article] [PubMed] [Google Scholar]
- 15.Ward E, DeSantis C, Robbins A, Kohler B, Jemal A. Childhood and adolescent cancer statistics, 2014. CA Cancer J Clin. 2014;64(2):83–103. doi: 10.3322/caac.21219. [DOI] [PubMed] [Google Scholar]
- 16.Williamson D, et al. Fusion gene-negative alveolar rhabdomyosarcoma is clinically and molecularly indistinguishable from embryonal rhabdomyosarcoma. J Clin Oncol. 2010;28(13):2151–2158. doi: 10.1200/JCO.2009.26.3814. [DOI] [PubMed] [Google Scholar]
- 17.Weigel BJ, et al. Intensive multiagent therapy, including dose-compressed cycles of ifosfamide/etoposide and vincristine/doxorubicin/cyclophosphamide, irinotecan, and radiation, in patients with high-risk rhabdomyosarcoma: A report from the Children’s Oncology Group. J Clin Oncol. 2016;34(2):117–122. doi: 10.1200/JCO.2015.63.4048. [DOI] [PMC free article] [PubMed] [Google Scholar]
- 18.Shern JF, et al. Comprehensive genomic analysis of rhabdomyosarcoma reveals a landscape of alterations affecting a common genetic axis in fusion-positive and fusion-negative tumors. Cancer Discov. 2014;4(2):216–231. doi: 10.1158/2159-8290.CD-13-0639. [DOI] [PMC free article] [PubMed] [Google Scholar]
- 19.Olanich ME, Barr FG. A call to ARMS: Targeting the PAX3-FOXO1 gene in alveolar rhabdomyosarcoma. Expert Opin Ther Targets. 2013;17(5):607–623. doi: 10.1517/14728222.2013.772136. [DOI] [PMC free article] [PubMed] [Google Scholar]
- 20.Fewell SW, et al. Small molecule modulators of endogenous and co-chaperone-stimulated Hsp70 ATPase activity. J Biol Chem. 2004;279(49):51131–51140. doi: 10.1074/jbc.M404857200. [DOI] [PubMed] [Google Scholar]
- 21.Wisén S, et al. Binding of a small molecule at a protein-protein interface regulates the chaperone activity of hsp70-hsp40. ACS Chem Biol. 2010;5(6):611–622. doi: 10.1021/cb1000422. [DOI] [PMC free article] [PubMed] [Google Scholar]
- 22.Rodina A, et al. Identification of an allosteric pocket on human hsp70 reveals a mode of inhibition of this therapeutically important protein. Chem Biol. 2013;20(12):1469–1480. doi: 10.1016/j.chembiol.2013.10.008. [DOI] [PMC free article] [PubMed] [Google Scholar]
- 23.Zhao R, et al. Navigating the chaperone network: An integrative map of physical and genetic interactions mediated by the hsp90 chaperone. Cell. 2005;120(5):715–727. doi: 10.1016/j.cell.2004.12.024. [DOI] [PubMed] [Google Scholar]
- 24.Marciniak SJ, et al. CHOP induces death by promoting protein synthesis and oxidation in the stressed endoplasmic reticulum. Genes Dev. 2004;18(24):3066–3077. doi: 10.1101/gad.1250704. [DOI] [PMC free article] [PubMed] [Google Scholar]
- 25.Walter P, Ron D. The unfolded protein response: From stress pathway to homeostatic regulation. Science. 2011;334(6059):1081–1086. doi: 10.1126/science.1209038. [DOI] [PubMed] [Google Scholar]
- 26.Felciano RM, et al. 2013. Predictive systems biology approach to broad-spectrum, host-directed drug target discovery in infectious diseases. Pacific Symposium on Biocomputing. pp 17–28.
- 27.Subramanian A, et al. Gene set enrichment analysis: A knowledge-based approach for interpreting genome-wide expression profiles. Proc Natl Acad Sci USA. 2005;102(43):15545–15550. doi: 10.1073/pnas.0506580102. [DOI] [PMC free article] [PubMed] [Google Scholar]
- 28.Xie X, et al. Systematic discovery of regulatory motifs in human promoters and 3′ UTRs by comparison of several mammals. Nature. 2005;434(7031):338–345. doi: 10.1038/nature03441. [DOI] [PMC free article] [PubMed] [Google Scholar]
- 29.Han J, et al. ER-stress-induced transcriptional regulation increases protein synthesis leading to cell death. Nat Cell Biol. 2013;15(5):481–490. doi: 10.1038/ncb2738. [DOI] [PMC free article] [PubMed] [Google Scholar]
- 30.Lu M, et al. Opposing unfolded-protein-response signals converge on death receptor 5 to control apoptosis. Science. 2014;345(6192):98–101. doi: 10.1126/science.1254312. [DOI] [PMC free article] [PubMed] [Google Scholar]
- 31.Novoa I, Zeng H, Harding HP, Ron D. Feedback inhibition of the unfolded protein response by GADD34-mediated dephosphorylation of eIF2alpha. J Cell Biol. 2001;153(5):1011–1022. doi: 10.1083/jcb.153.5.1011. [DOI] [PMC free article] [PubMed] [Google Scholar]
- 32.Atkins C, et al. Characterization of a novel PERK kinase inhibitor with antitumor and antiangiogenic activity. Cancer Res. 2013;73(6):1993–2002. doi: 10.1158/0008-5472.CAN-12-3109. [DOI] [PubMed] [Google Scholar]
- 33.Hamanaka RB, Bennett BS, Cullinan SB, Diehl JA. PERK and GCN2 contribute to eIF2alpha phosphorylation and cell cycle arrest after activation of the unfolded protein response pathway. Mol Biol Cell. 2005;16(12):5493–5501. doi: 10.1091/mbc.E05-03-0268. [DOI] [PMC free article] [PubMed] [Google Scholar]
- 34.Paton AW, et al. AB5 subtilase cytotoxin inactivates the endoplasmic reticulum chaperone BiP. Nature. 2006;443(7111):548–552. doi: 10.1038/nature05124. [DOI] [PubMed] [Google Scholar]
- 35.Powers MV, Clarke PA, Workman P. Dual targeting of HSC70 and HSP72 inhibits HSP90 function and induces tumor-specific apoptosis. Cancer Cell. 2008;14(3):250–262. doi: 10.1016/j.ccr.2008.08.002. [DOI] [PubMed] [Google Scholar]
- 36.Davicioni E, Anderson JR, Buckley JD, Meyer WH, Triche TJ. Gene expression profiling for survival prediction in pediatric rhabdomyosarcomas: A report from the children’s oncology group. J Clin Oncol. 2010;28(7):1240–1246. doi: 10.1200/JCO.2008.21.1268. [DOI] [PMC free article] [PubMed] [Google Scholar]
- 37.Barr FG, et al. Genomic and clinical analyses of 2p24 and 12q13-q14 amplification in alveolar rhabdomyosarcoma: A report from the Children’s Oncology Group. Genes Chromosomes Cancer. 2009;48(8):661–672. doi: 10.1002/gcc.20673. [DOI] [PMC free article] [PubMed] [Google Scholar]
- 38.Palam LR, Baird TD, Wek RC. Phosphorylation of eIF2 facilitates ribosomal bypass of an inhibitory upstream ORF to enhance CHOP translation. J Biol Chem. 2011;286(13):10939–10949. doi: 10.1074/jbc.M110.216093. [DOI] [PMC free article] [PubMed] [Google Scholar]
- 39.Slamon DJ, et al. Human breast cancer: Correlation of relapse and survival with amplification of the HER-2/neu oncogene. Science. 1987;235(4785):177–182. doi: 10.1126/science.3798106. [DOI] [PubMed] [Google Scholar]
- 40.Smith I, et al. HERA study team 2-year follow-up of trastuzumab after adjuvant chemotherapy in HER2-positive breast cancer: A randomised controlled trial. Lancet. 2007;369(9555):29–36. doi: 10.1016/S0140-6736(07)60028-2. [DOI] [PubMed] [Google Scholar]
- 41.Halterman MW, et al. The endoplasmic reticulum stress response factor CHOP-10 protects against hypoxia-induced neuronal death. J Biol Chem. 2010;285(28):21329–21340. doi: 10.1074/jbc.M109.095299. [DOI] [PMC free article] [PubMed] [Google Scholar]
- 42.Duennwald ML, Lindquist S. Impaired ERAD and ER stress are early and specific events in polyglutamine toxicity. Genes Dev. 2008;22(23):3308–3319. doi: 10.1101/gad.1673408. [DOI] [PMC free article] [PubMed] [Google Scholar]
- 43.Zhang Y, et al. Hsp70 molecular chaperone facilitates endoplasmic reticulum-associated protein degradation of cystic fibrosis transmembrane conductance regulator in yeast. Mol Biol Cell. 2001;12(5):1303–1314. doi: 10.1091/mbc.12.5.1303. [DOI] [PMC free article] [PubMed] [Google Scholar]
- 44.Alter J, Bengal E. Stress-induced C/EBP homology protein (CHOP) represses MyoD transcription to delay myoblast differentiation. PLoS One. 2011;6(12):e29498. doi: 10.1371/journal.pone.0029498. [DOI] [PMC free article] [PubMed] [Google Scholar]
- 45.Dey S, et al. ATF4-dependent induction of heme oxygenase 1 prevents anoikis and promotes metastasis. J Clin Invest. 2015;125(7):2592–2608. doi: 10.1172/JCI78031. [DOI] [PMC free article] [PubMed] [Google Scholar]
- 46.Lin JH, et al. IRE1 signaling affects cell fate during the unfolded protein response. Science. 2007;318(5852):944–949. doi: 10.1126/science.1146361. [DOI] [PMC free article] [PubMed] [Google Scholar]
- 47.Thomas A, Liu SV, Subramaniam DS, Giaccone G. Refining the treatment of NSCLC according to histological and molecular subtypes. Nat Rev Clin Oncol. 2015;12(9):511–526. doi: 10.1038/nrclinonc.2015.90. [DOI] [PubMed] [Google Scholar]
- 48.Luo J, Solimini NL, Elledge SJ. Principles of cancer therapy: Oncogene and non-oncogene addiction. Cell. 2009;136(5):823–837. doi: 10.1016/j.cell.2009.02.024. [DOI] [PMC free article] [PubMed] [Google Scholar]
- 49.Pfaffl MW. A new mathematical model for relative quantification in real-time RT-PCR. Nucleic Acids Res. 2001;29(9):e45. doi: 10.1093/nar/29.9.e45. [DOI] [PMC free article] [PubMed] [Google Scholar]
- 50.Li B, Dewey CN. RSEM: Accurate transcript quantification from RNA-Seq data with or without a reference genome. BMC Bioinformatics. 2011;12:323. doi: 10.1186/1471-2105-12-323. [DOI] [PMC free article] [PubMed] [Google Scholar]
- 51.Anders S, Huber W. Differential expression analysis for sequence count data. Genome Biol. 2010;11(10):R106. doi: 10.1186/gb-2010-11-10-r106. [DOI] [PMC free article] [PubMed] [Google Scholar]


