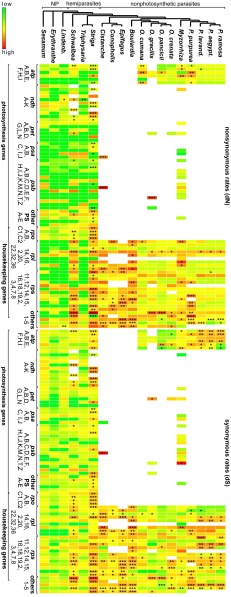
Fig. 1.
Rate variation in Orobanchaceae. Heatmaps illustrate differences in dN and dS for each plastid protein gene (as named from top to bottom per gene class), with low rates shown in green and high rates in red. A phylogenetic tree on top indicates species relationships and the trophic specialization. Asterisks indicate the significance of LRTs of a focal taxon against the non-Orobanchaceae taxa (significance levels: *P < 0.05, **P < 0.01, ***P < 0.001). other PS, other photosynthesis genes (A, ccsA; B, cemA; C, rbcL; D, ycf3; E, ycf4), other HK, housekeeping and metabolic genes (1, matK; 2, infA; 3, ycf2; 4, clpP; 5, accD).

