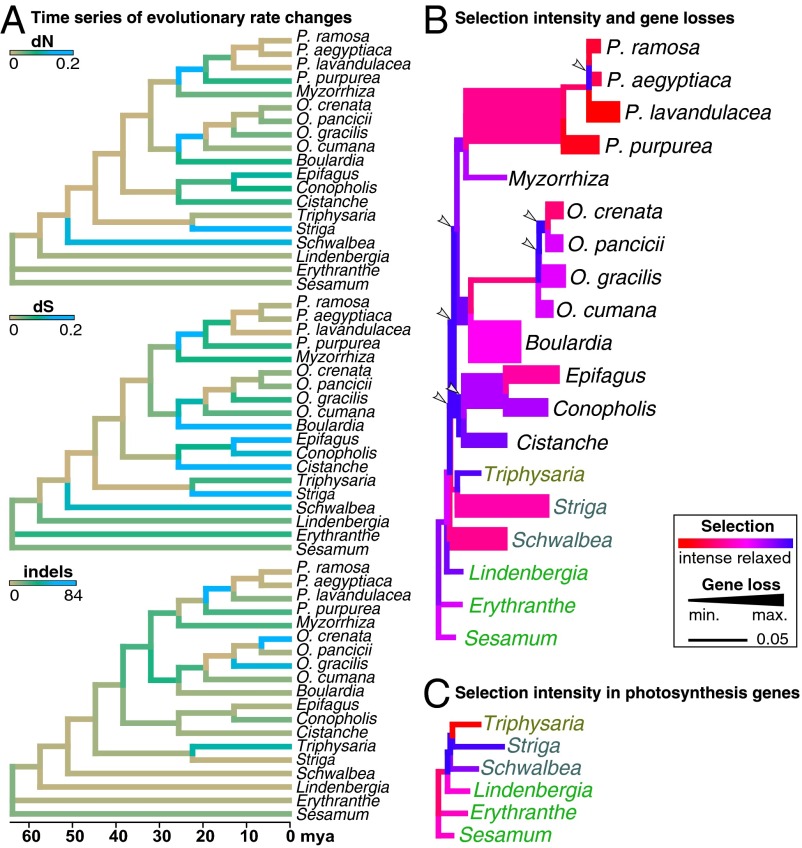
Fig. 2.
Evolution of selectional strength. (A) Evolution of dN, dS, and indels shown on the dated phylogeny. Low rates of nucleotide substitutions and indels are shown in brown and high ones in blue. (B) Selectional changes per branch across all universal protein genes (as in Fig. 1) are color-coded according to the selection strength parameter k, inferred under the general descriptive RELAX model (13). Low k (<1, blue) indicates a relaxation of purifying selection (i.e., a weaker deviation from neutral evolution), whereas high k (>1, red) suggests selection intensification. Branch widths are proportional to the number of gene losses per branch. Arrowheads mark phases of selection relaxations occurring before inferred gene losses. (C) Selectional changes per branch across all photosynthesis genes (as in Fig. 1); colors as in B.

