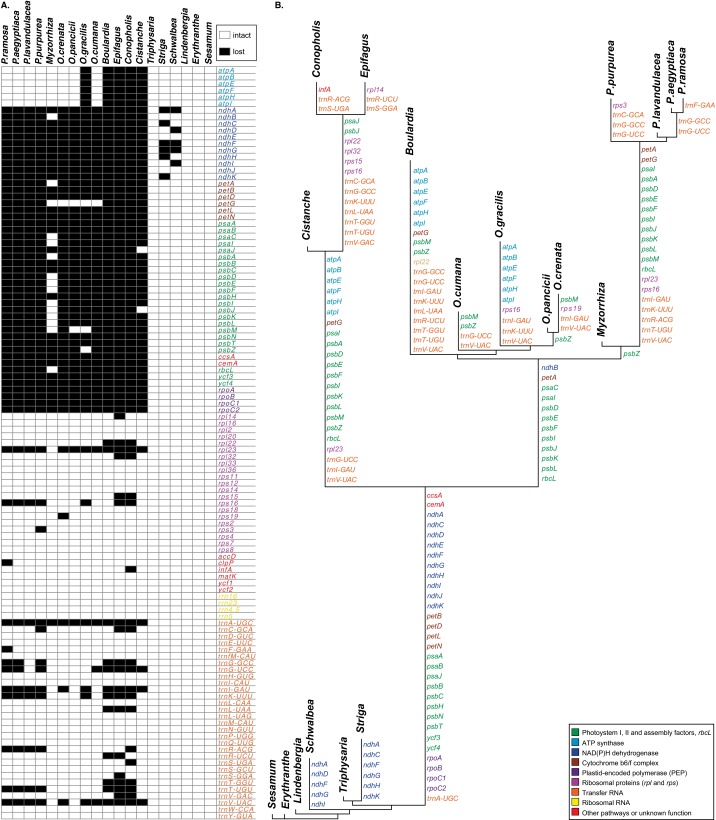
Fig. S1.
Gene content and its evolution. (A) Matrix showing presence (white) or functional or physical absence (black) of genes (names to the right) in Orobanchaceae and the closely related E. guttata and S. indicum. (B) Inferred gene losses in Orobanchaceae, reconstructed using ML. Branch lengths are proportional to the number of (functionally or physically) lost genes, whose names are given along the branches.

