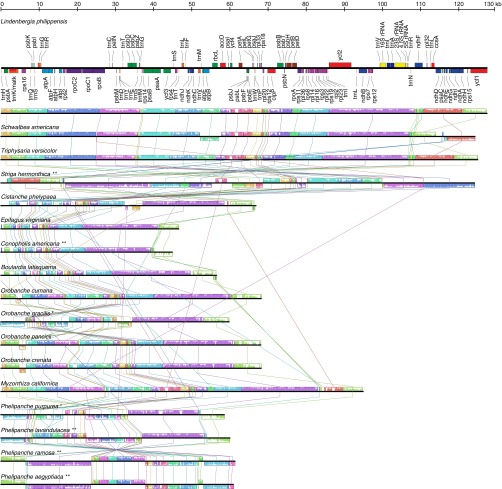
Fig. S2.
Plastid genome organization in Orobanchaceae. Physical map of the plastid gene arrangement in L. philippensis with genes being colored according to their functional classes (as in Fig. S1), and locally collinear blocks (LCB) from whole plastome alignments of L. philippensis and 16 parasitic Orobanchaceae. Colored blocks represent distinct LCBs. Colored bars inside the LCBs show the similarity within these regions among the different species, whereby longer bars indicate a greater similarity. One copy of the large inverted repeat (IR, longest purple LCB) region was removed for the plastome alignment. One asterisk indicates that an IR exists in the plastome, but with a considerably reduced length compared with L. philippensis; two asterisks indicate the loss of the IR from the plastome.

