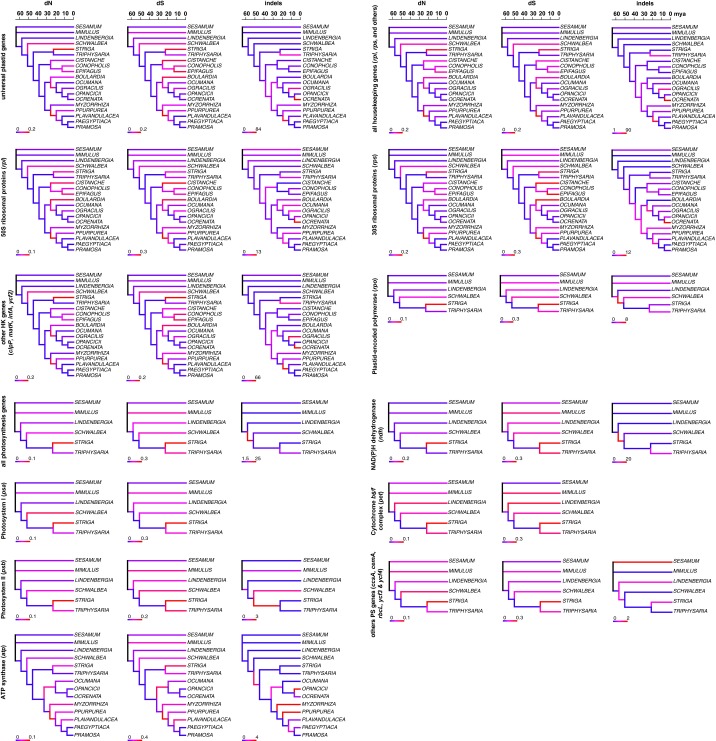
Fig. S3.
Time series of changes in evolutionary rates and indels. Changes in dS, dN, and indels, shown for all universal genes as well as functional classes and gene categories (as indicated), are traced over the dated phylogeny (scales in million years). Low substitution rates and indel numbers are shown in blue, high ones in red; the extent of these changes is indicated by the scale bars at the bottom left of each tree. Because psa and pet genes lack indels, the respective trees are not shown. HK, housekeeping; PS, photosynthesis.

