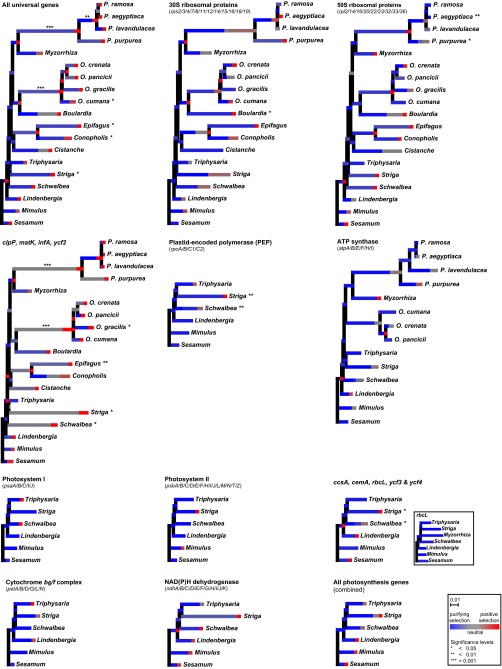
Fig. S4.
Tests for adaptive evolution in Orobanchaceae. The proportion of sites evolving under different selectional regimes is illustrated as stacked branches, where each stack represents one of the three distinct ω classes: purifying selection (ω < 1) in shades of blue, neutral evolution (ω ∼ 1) in shades of gray, and positive selection (ω > 1) in shades of red. Significant changes in the proportion of sites under positive selection are marked by asterisks behind the taxon names, whose number indicates the significance level as detailed in Inset. See SI Materials and Methods for details of the test method.

