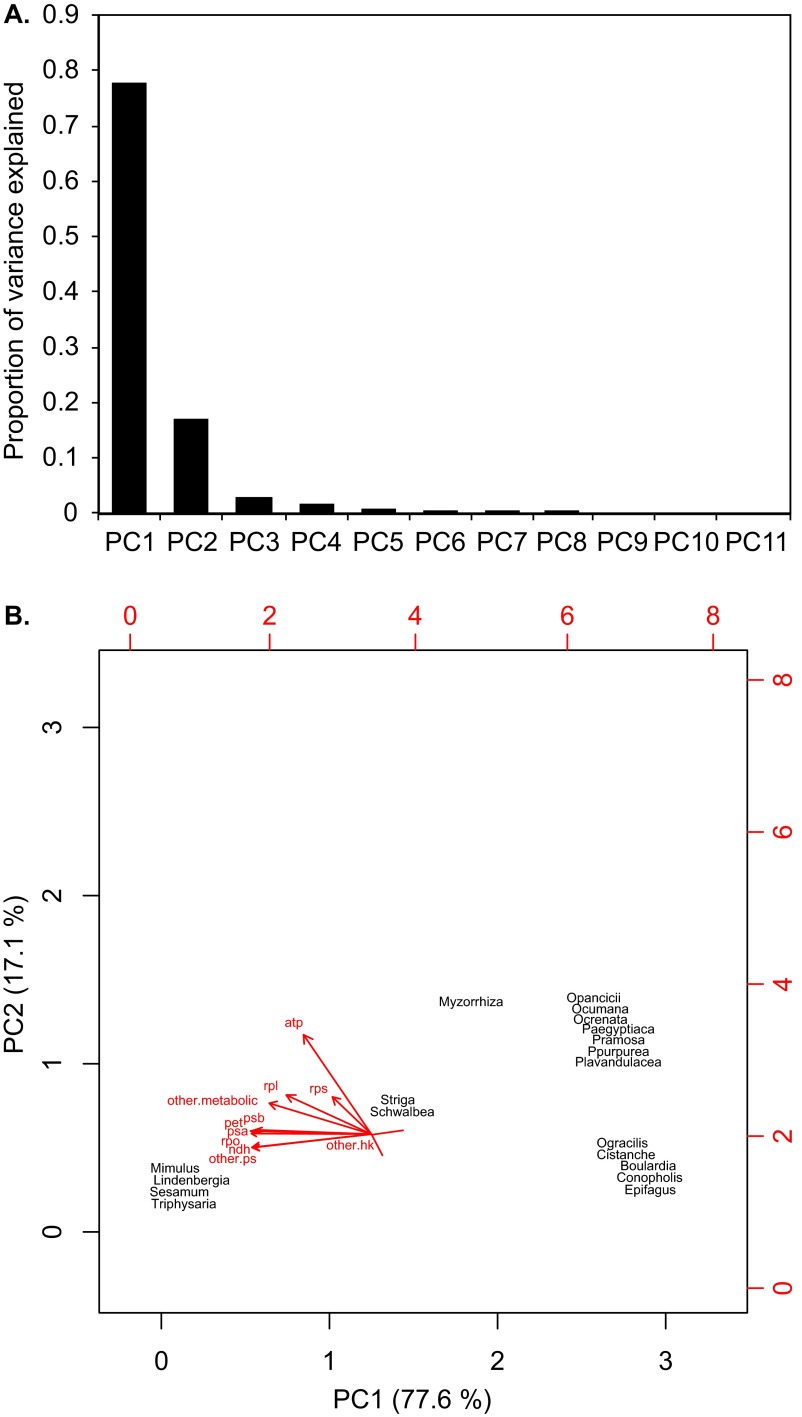
Fig. S5.
Phylogenetic principal component analysis. (A) The screeplot illustrates the variances for each component in descending order. (B) The biplot shows the position of species in ordination space (black) and the different variables (vectors in red). The explained variances (in percent) are provided for PC1 and PC2 in the axis labels.

