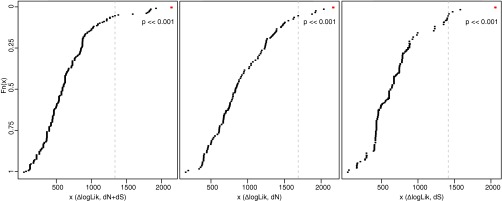
Fig. S7.
Parametric bootstrap analysis of trait-dependent nucleotide substitution rate shifts. To analyze the effect of lifestyle changes on the total substitution rate (dN+dS) (Left) and on dN (Center) and dS (Right) separately, we simulated 200 datasets and plotted the log-likelihood difference (∆logLik) between the null and the alternative model estimated from these simulated datasets (black dots) against the log-likelihood difference from the real data (red dot). The parametric bootstrap (41) tests whether the observed rate variation correlates with the investigated trait (here lifestyle) significantly more often than with uncorrelated traits that may evolve in a similar manner. We tested whether the observed likelihood ratio (i.e., the difference in logarithmic space) lies within the distribution of likelihood ratios obtained from the simulated datasets (H0, no difference between the observed and simulated likelihood ratio; HA, observed likelihood ratio differs from the simulated data). A dashed line indicates the critical value of the 0.05 significance level for a one-sided test.

