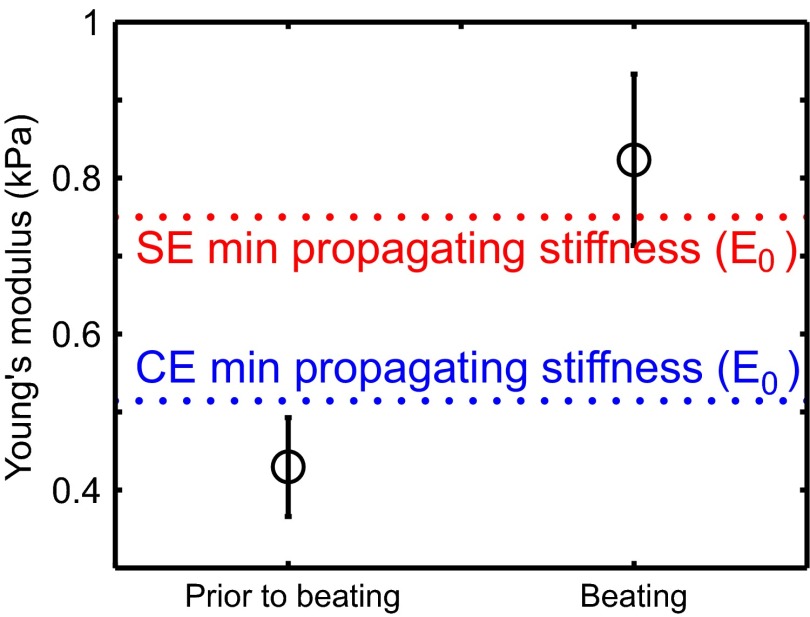
Fig. 3.
Measurements of heart stiffness before and after the appearance of heartbeats, compared with minimum stiffness necessary to support a mechanically coordinated contraction in our model. Stiffness is measured via micropipette aspiration for six Hamburger–Hamilton (HH) stage 10 and five HH stage 11 hearts, corresponding to E1.5–E2 (Materials and Methods). Dashed lines indicate predicted values for the CE (blue) and SE (red) models, corresponding to the lower-stiffness cutoffs shown in Fig. 2A.

