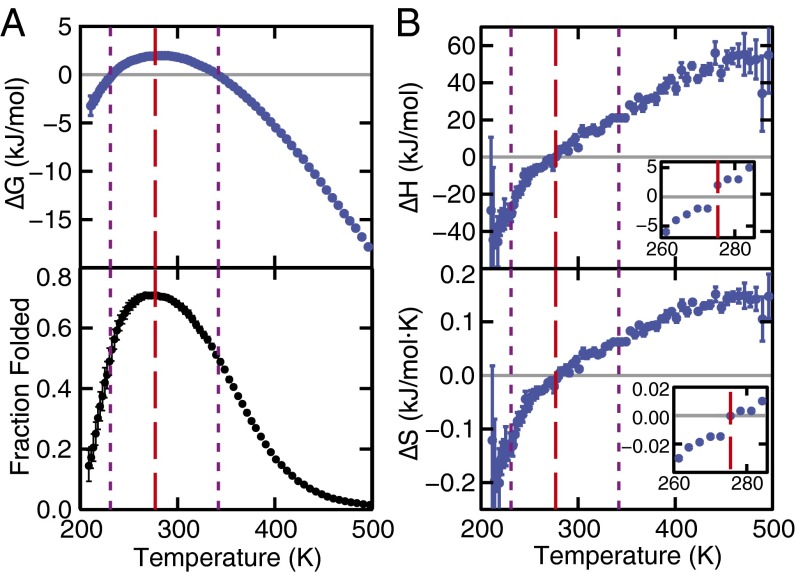
Fig. 1.
(A) The unfolding free-energy change (Upper) and the fraction of folded proteins (Lower) as a function of temperature. (B) The corresponding enthalpy and entropy changes. The temperature at which the fold fraction is a maximum is 277 K (red dashed line), and the melting and cold unfolding temperatures (x = 0.5, purple dotted lines) are located at 231 K and 342 K, respectively. Error bars are explicitly shown or are smaller than the symbols. See Materials and Methods for error calculation.

