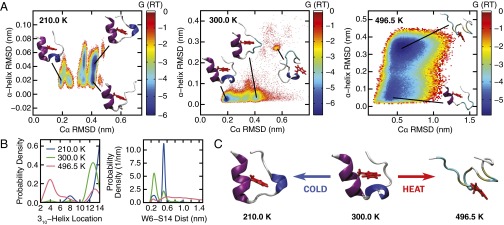
Fig. 2.
(A) The free-energy surface (reported in units of RT) associated with the order parameters Cα rmsd and α-helix rmsd at 210, 300, and 496.5 K. The protein structures show representative configurations for selected basins identified on the free-energy surface. (B) Probability distribution of the location of Trp-cage’s three-residue-long 310-helix structure (Left). The number reported on the abscissa denotes the residue on which the 310-helix is centered. The discrete distributions are represented using a continuous spline function for visual clarity. The most probable location of Trp-cage’s 310-helix shifts from residue 12–14 as the Trp-cage cold denatures. (Right) Distance between residues W6 and S14. As the Trp-cage cold denatures at 210 K, the separation between W6 and S14 widens. (C) Representative protein configurations from the most populated states at 210, 300, and 496.5 K. Trp-cage’s α-helix, 310-helix, and aromatic side chain on residue W6 are rendered in purple, blue, and red, respectively.

