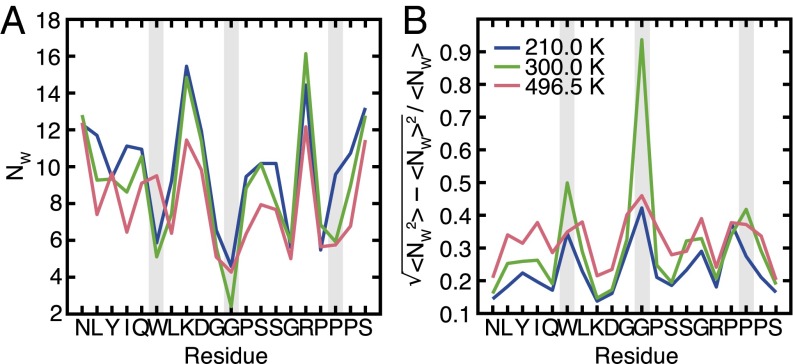
Fig. 5.
(A) Average number of water molecules within 0.4 nm of each residue. (B) Normalized fluctuation in the number of water molecules near each residue, a measure of residue effective hydrophobicity. The gray bars highlight the location of residues W6, G11, and P18, which exhibit a significant reduction in their effective hydrophobicity upon cooling to 210 K.

