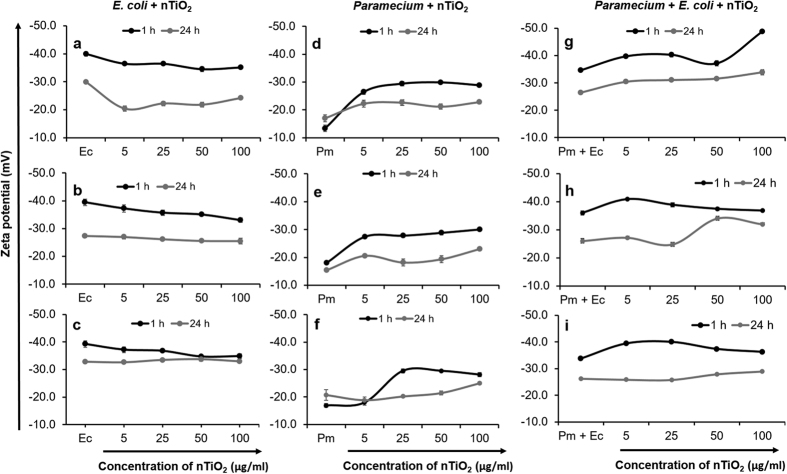
Figure 1. Zeta potential of nTiO2 in different zones of the experimental tube at 1 h and 24 h.
(a–c) nTiO2 incubated with E. coli, (d–f) nTiO2 incubated with Paramecium, (g–i) nTiO2 incubated with Paramecium and E. coli. (a,d,g) = upper zone; (b,e,h) = middle zone and (c,f,i) = lower zone. Ec, E. coli, Pm, Paramecium. Values represented are the mean ± SE of three independent experiments.

