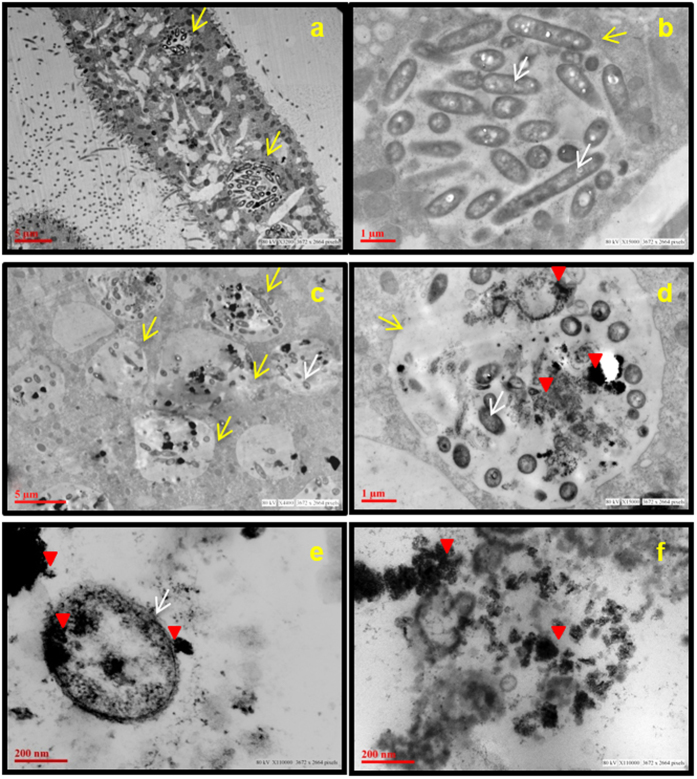
Figure 7. The interaction of Paramecium with E. coli and nTiO2 after 1 h of incubation.
Transmission electron microscopy images, (a,b) control, and (c–f) treated cells (25 μg/ml) showing the presence of E. coli and nTiO2 in food vacuoles (c,d). nTiO2 is present inside (e) and outside E. coli cells (f). Red arrowhead represents nTiO2, yellow arrow represents food vacuoles and white arrow represents bacteria.

