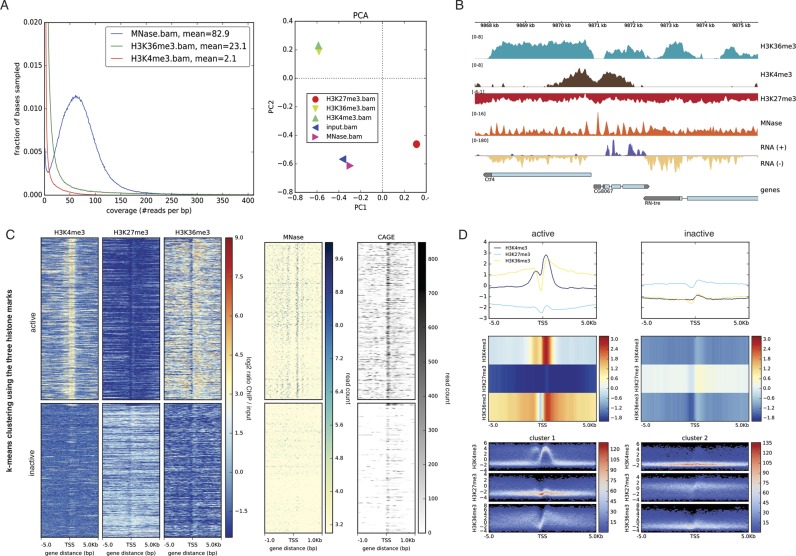
Figure 1.
deepTools2 has enhanced features for quality control, data reduction, normalization and visualization of deeply sequenced data. (A) deepTools2 comes with two new quality control tools: plotCoverage, which displays sequencing depth distribution; and plotPCA, which plots the results of principal component analysis (PCA) on BAM or bigWig files. (B) Signal visualization by means of normalized bigWig tracks, produced by deepTools’ bamCompare (ChIP-seq samples) and bamCoverage, which can now handle MNase- and strand-specific RNA-seq samples. In the genes track, the gray color represents untranslated regions and the thin lines represent introns. (C) computeMatrix and plotHeatmap were used to summarize and cluster multiple bigWig scores over genomic intervals. The image shows the resulting k-means clustering of ChIP-seq signals of three histone marks around the transcription start site of genes (with k = 2). Subsequently, the clustered regions were used to plot MNase-seq and CAGE read coverages. In the image, each row corresponds to the same genomic region. (D) plotProfile now offers additional means for visualization. The top panel shows the average signal for different samples and different cluster of regions (left and right plot). In the middle, the same profiles are represented as heatmaps. The bottom panel shows summary profiles where colors correspond to the observed frequency of the signal within each cluster. All data are from the Drosophila melanogaster S2 cell line and are publically available (see Section Accession numbers).

