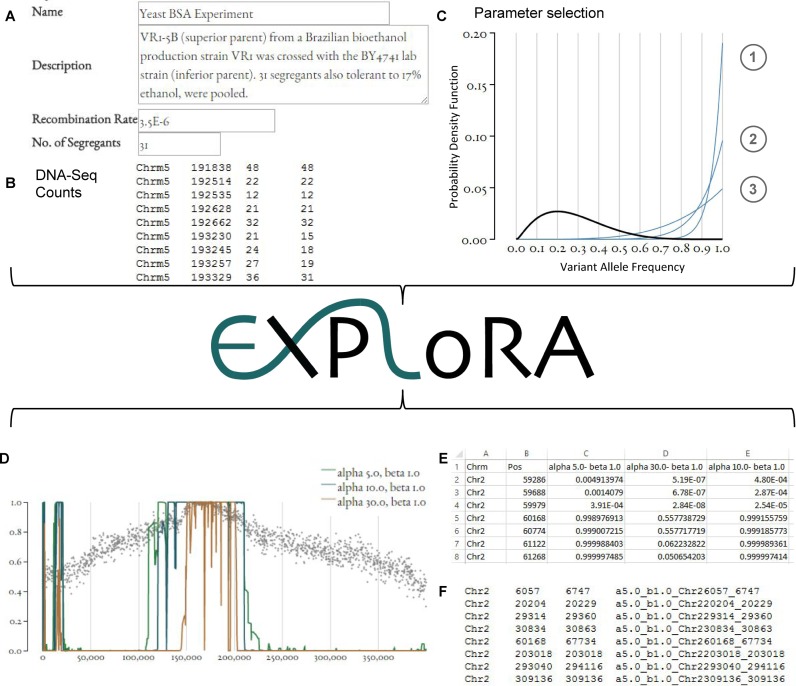
Figure 1.
Overview of the web service. (A) Input experimental information. (B) Upload count data. (C) Parameter selection. The black line corresponds to the cumulative distribution of allele frequencies (alternative read count/total read count) derived from the uploaded data and is used to estimate the probability distribution that models the emission probability of the neutral state allele distribution. The blue lines represent the β-distributions model for each of the three different ratios of α/β where line 1 corresponds to a setting reflecting high specificity and low sensitivity, line 2 medium specificity and sensitivity and line 3 low specificity and high sensitivity. (D) Visual Output. The X-axis corresponds to the chromosomal positions and the Y-axis to the posterior probabilities obtained for each marker site. (E) Posterior distributions of the marker sites for each parameter setting. (F) BED file indicating the regions linked to the phenotype.

