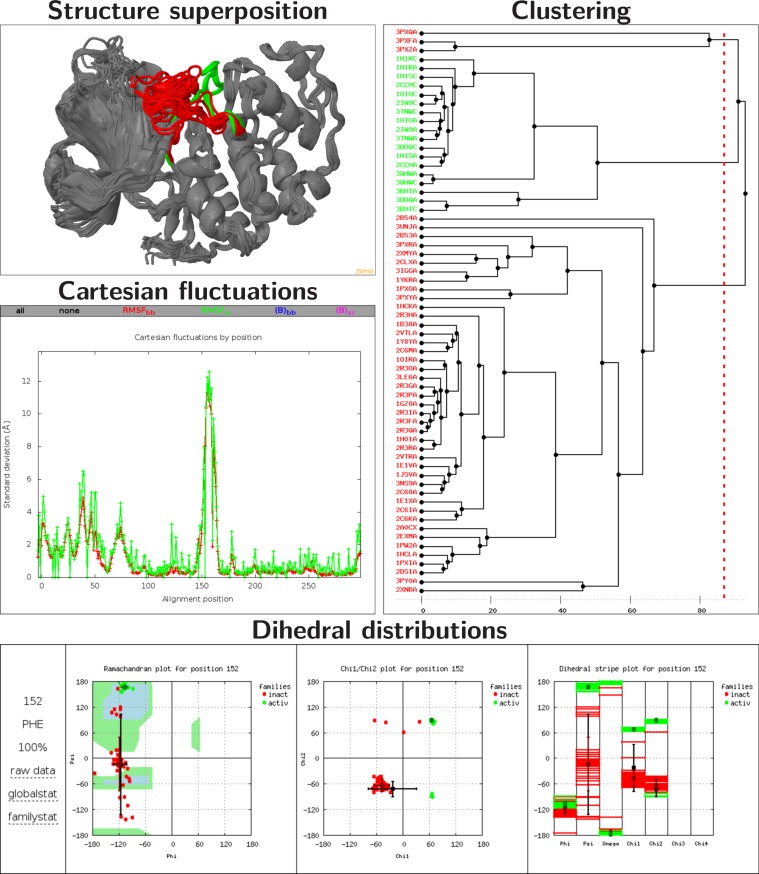
Figure 1.
Overview of PSSweb capabilities on an example application. Structure superposition. Superposition of 64 CDK2 structures on 1HCK:A, visualized with a JSmol (5) viewer. The L12 helix and T-loop region (residues 144–166), which undergoes a major conformational change between inactive and active states, is highlighted in red and green for the inactive and active states, respectively. Cartesian fluctuations. Standard deviation of Cartesian coordinates, for backbone or sidechain atoms as a function of the alignment position. Zero points in sidechain fluctuations correspond to Gly residues. Dihedral coordinate fluctuations can also be obtained. Dihedral distributions. Dihedral distributions for the residue Phe152 of inactive (red) and active (green) structures. Average values and standard deviations, by family and globally, are also indicated. Left: Ramachandran plot. Center: χ1/χ2 plot. Right: dihedral stripe plot. Clustering The tree is obtained from hierarchical clustering with the maximum-linkage method. Variables taken into account are the ϕ and ψ angles of the L12 helix and T-loop region. Inactive and active structure PDB codes are respectively written in red and green.

