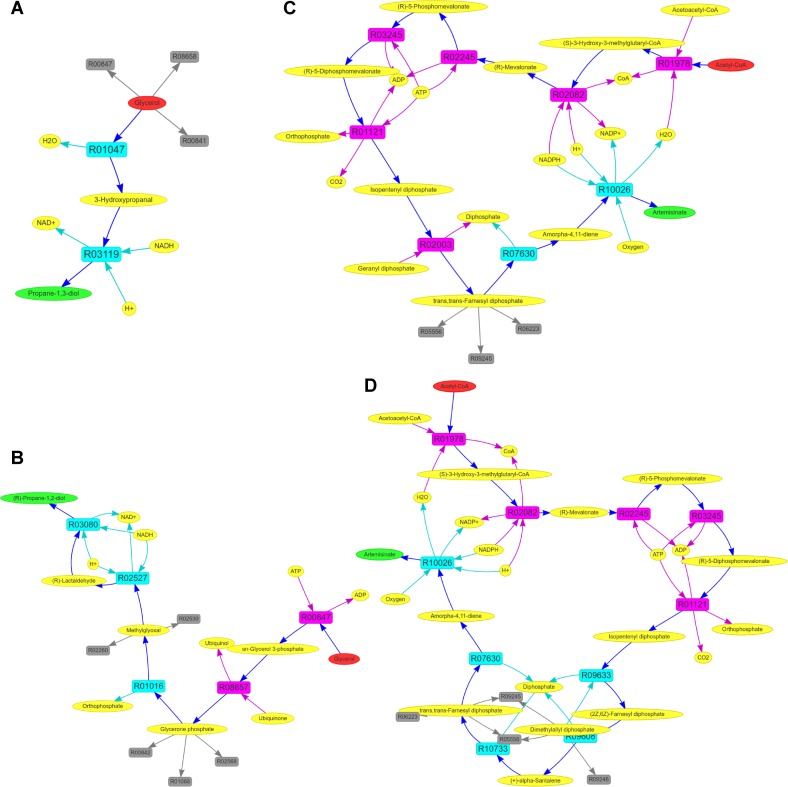
Figure 6.
Pathway-level graphs generated in MRE. (A) The top-ranked pathway for the production of 1,3-PDO from glycerol in E. coli. (B) The top-ranked pathway for the production of R-1,2-PDO from glycerol in yeast. (C) A known pathway and (D) top-ranked pathway for the production of artemisinic acid from acetyl-CoA in yeast. In these graphs, oval nodes represent compounds, while box nodes represent reactions. For compound nodes, red nodes are the starting material, green nodes are the target products and yellow nodes are other compounds. For reaction nodes, purple nodes are native reactions, cyan nodes are foreign reactions and gray nodes are competing native reactions.

