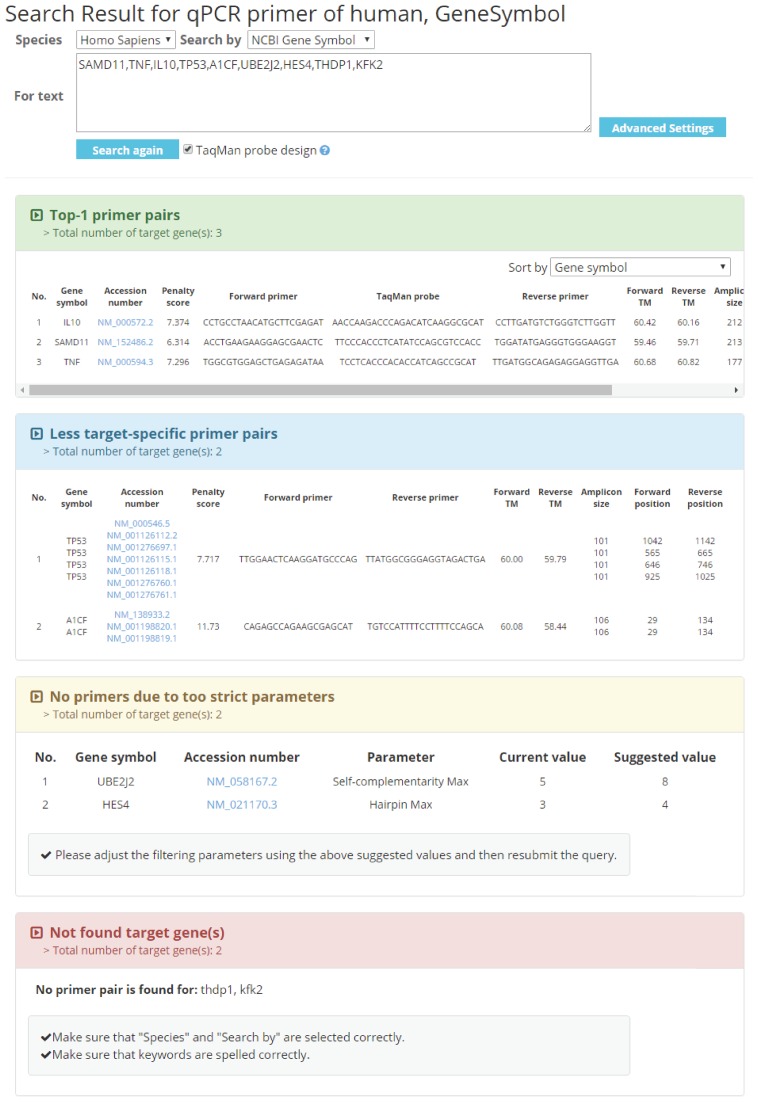
Figure 3.
Output interface of MRPrimerW. MRPrimerW displays the four tables. The first table shows top primer pairs for specific target genes. The second table shows a set of less target-specific primers for the query genes having no results in the first table. The third table shows the set of genes that may have target-specific primer pairs if the filtering constraints are relaxed and guidelines on how to adjust the constraints. The fourth table shows the set of genes that may be wrong or have typos.

