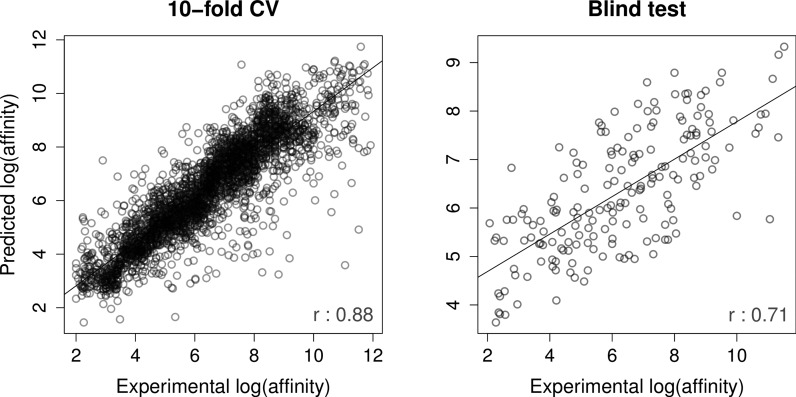
Figure 3.
Regression plot between experimental and predicted affinities by CSM-lig on the PDBbind 2014 release. The graph on the left-hand side depicts the performance of CSM-lig over 10-fold cross validation, achieving a Pearson's correlation of 0.88 (using 3167 protein–ligand complexes). The performance in blind test for this release was 0.71 (composed by 184 protein–ligand complexes).

