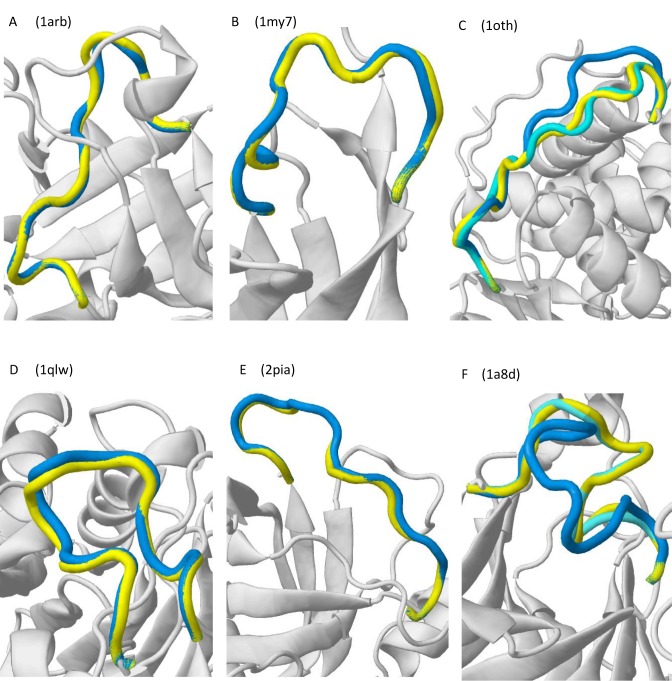
Figure 3.
Illustrative cases of the server performance with benchmark test cases. In all the cases, the first ranked model (lowest energy) is depicted in blue, the native loop in yellow and the protein environment in gray. Alternative solutions found in the 12nd best (1oth) and 2nd best (1a8d) top-ranked predictions are colored in cyan.

