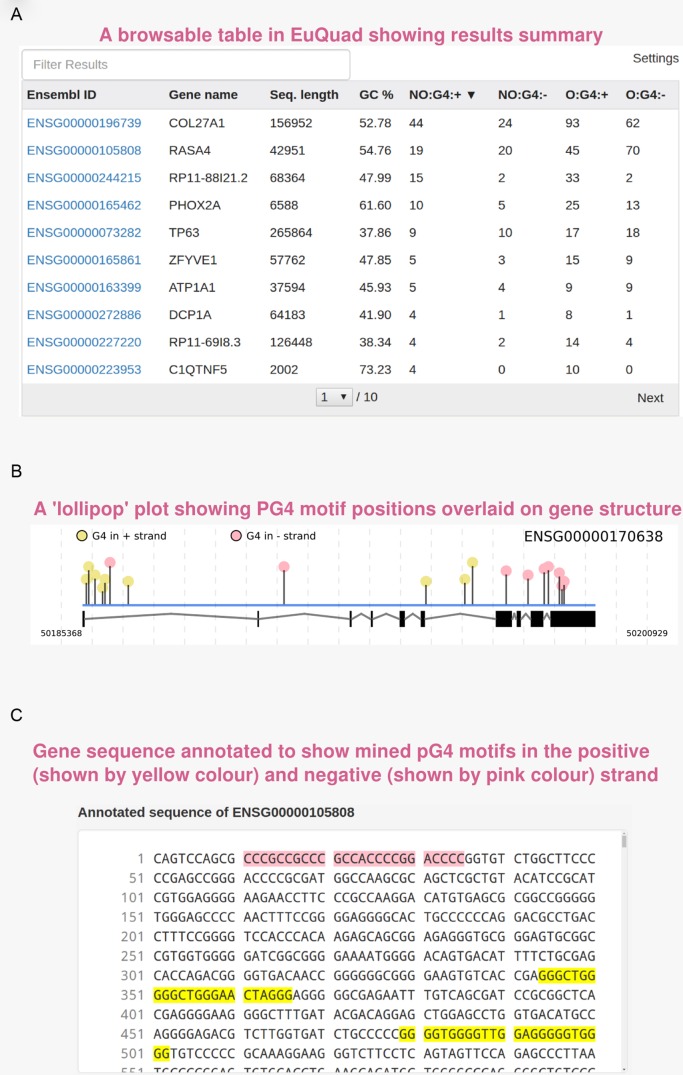
Figure 3.
Screenshots of example output: the result page of EuQuad showing three main result elements. (A) The result table shows name of selected genes/input FASTA headers along with PG4 statistics. Each column is sortable and clicking on any row will update the ‘lollipop’ plot and sequence view of the corresponding gene. (B) ‘Lollipop’ plots in EuQuad module help visualize the relative positions of PG4 motif over the gene structure. The gene structure is shown below the motifs. The black rectangles represent exons while lines represent introns. The height of each line corresponds to relative length of the motif compared to rest motifs in the same sequence. (C) The PG4 motifs detected are annotated on the sequence such that, those on the positive strand are highlighted in yellow while those on the negative strand are highlighted in pink.

