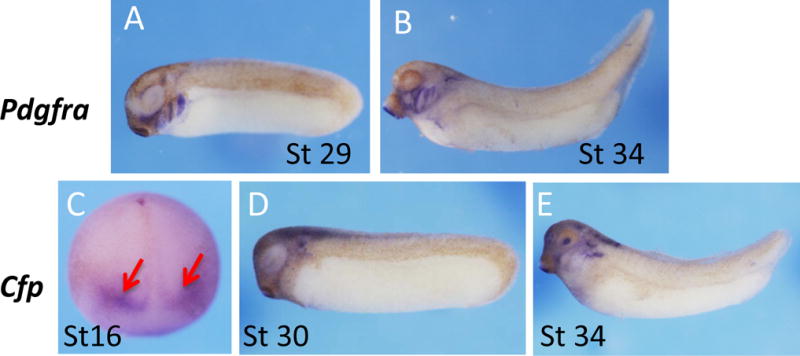
Fig. 3.

Spatial expression pattern of pdgfra and cfp. (A–B) Strong signals of pdgfra were detected in branchial arches at tail bud and tadpole stages. (C–E) Cfp signals were detected first at mid neurula stage, and appear as two stripes at the anterior neural plate indicated by red arrows (C). The signals were detected in brain, lens, and ear vesicle at tail bud and tadpole stages (D, E).
