
Fig. 5.
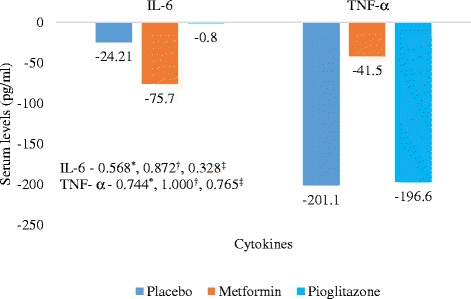
Mean decrease in levels of IL-6 and TNF-α in three treatment groups from baseline in subgroup of patients (Intention to treat Analysis). Values are expressed as Mean ± SD. Inter-group comparisons for IL-6 and TNF-α carried out by One way ANOVA, *- Metformin vs placebo, †- pioglitazone vs placebo, ‡ - metformin vs pioglitazone, IL-6 – Interleukin-6, TNF-α – Tumor necrosis factor-α