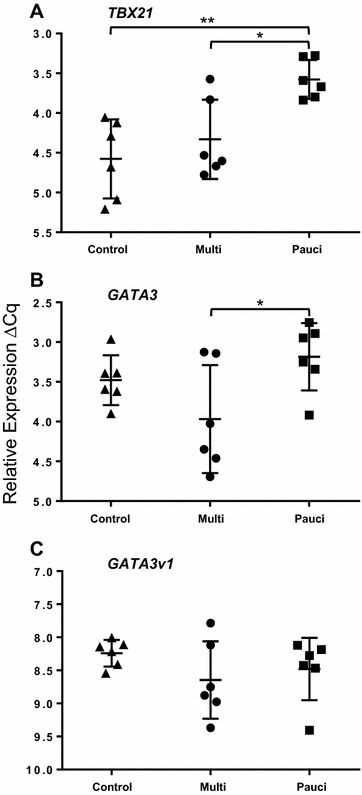
Figure 1.

Relative quantification of A TBX21, B GATA3 and C GATA3v1 in ICLN of paratuberculosis-diseased and uninfected control sheep. Each point is the mean ΔCq of three biological replicates per animal, each in duplicate. ANOVA: A TBX21, P = 0.003; B GATA3, P = 0.046; C GATA3v1, P = 0.32; error bars, ± SD. *≤ 0.05, >0.01; **≤0.01, 0.001; ***≤0.001.
