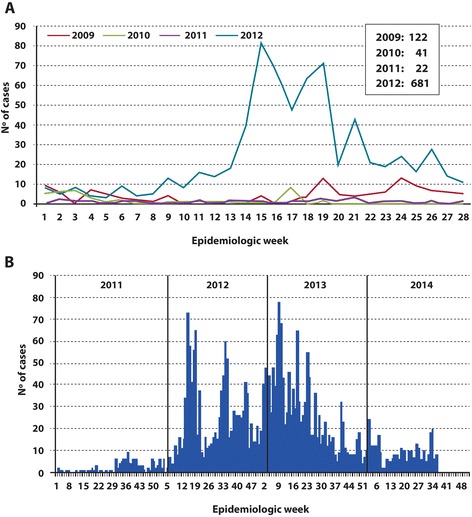
Fig. 1.

Weekly tally of pertussis-suspected cases according to year. Data obtained from the Peruvian Ministry of Health in 2012 (Panel a red curve, 2009; green curve, 2010; violet curve, 2011; azure curve, 2012) and 2014 (Panel b compressed curves for 2011 and 2012 next to the corresponding curves for 2013 and 2014 with the years indicated above the curves). In the figures, the number of cases is plotted on the ordinate as a function of the epidemiologic week on the abscissa
