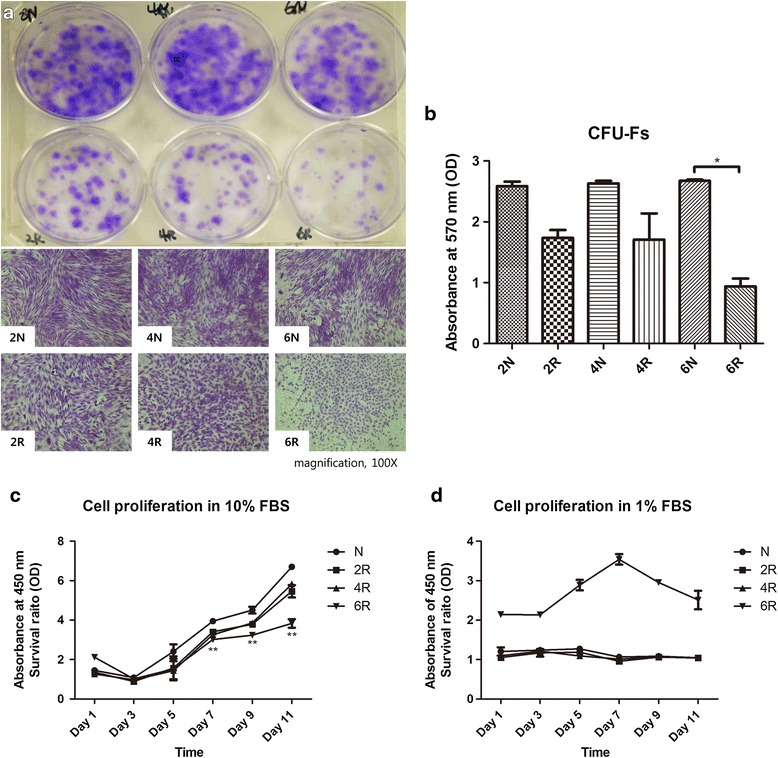
Fig. 2.

Proliferation capacity. a Macroscopic and microscopic view of colony-forming units (CFUs) determined by crystal violet staining. The number of viable ASC colonies formed was significantly more abundant in the N groups than in the 6R group. b Quantitative analysis of CFUs. CFU formation in the 6 N group was 2.5-fold higher than in the 6R group (* p < 0.05). c Cell Counting Kit-8 (CCK-8) assay with 10 % fetal bovine serum (FBS). The cell numbers in the 6R group were significantly lower than numbers in the N group after day 7 (** p < 0.01). d CCK-8 assay with 1 % FBS to analyze cellular growth under stress conditions. The cell numbers in the 6R group were higher than in the other groups throughout the entire experimental period. However, statistically significant differences were not obtained
