
Fig. 3.
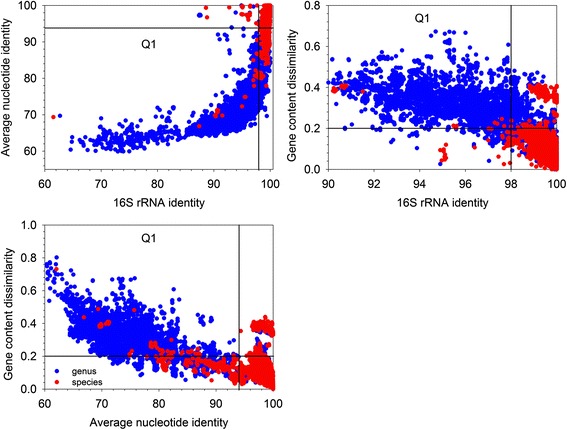
Comparison of 16S rRNA gene identity, ANI, and gene content dissimilarity in microbial species delineation. A cutoff of 0.2 corresponded to 98 % 16S rRNA gene identity and 94 % ANI in species delineation. A total of 5008 intra-species and 8642 intra-genus comparisons were plotted. Red dots falling in the Q1 quadrant were mostly several clostridium strains, for which misclassification may have occurred. Red dots represented intra-species comparisons, and blue dots indicated intra-genus comparisons