
Figure 3.
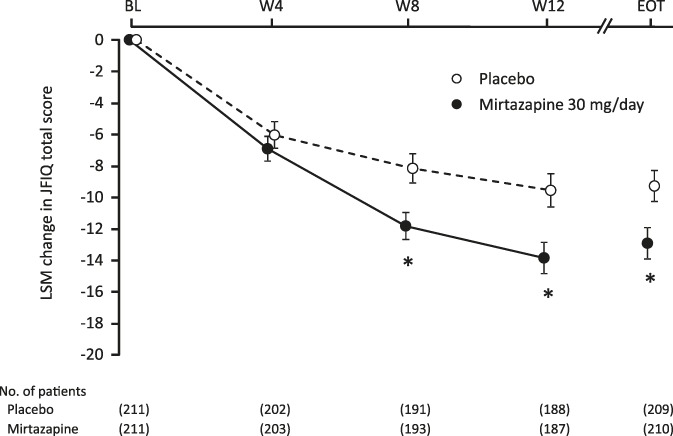
Changes in JFIQ total score over time. *P < 0.05 (each time point, mixed-effects model repeated measures approach; EOT, ANCOVA). ANCOVA, analysis of covariance; BL, baseline; EOT, end of treatment; JFIQ, the Japanese version of Fibromyalgia Impact Questionnaire; LSM, least square mean; W, week.