
Figure 2.
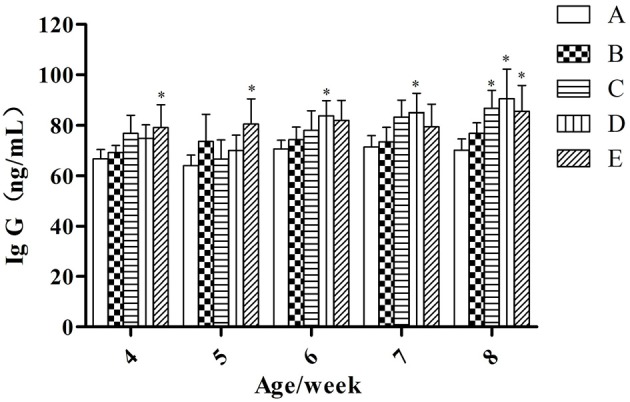
IgG concentration under different hygienic conditions (n = 60). *Means that the difference between treatment groups (B–E) and control group (A) was significant.
Official websites use .gov
A
.gov website belongs to an official
government organization in the United States.
Secure .gov websites use HTTPS
A lock (
) or https:// means you've safely
connected to the .gov website. Share sensitive
information only on official, secure websites.
IgG concentration under different hygienic conditions (n = 60). *Means that the difference between treatment groups (B–E) and control group (A) was significant.