
Figure 4.
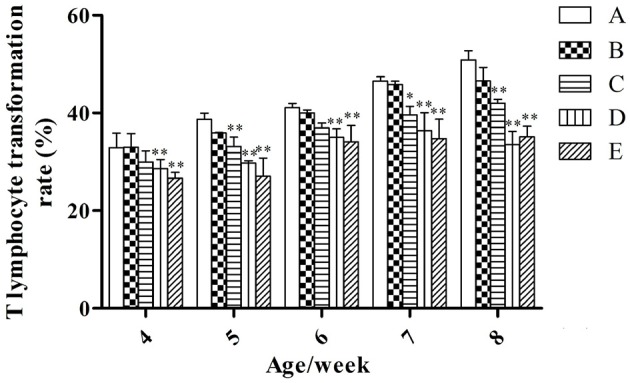
T-lymphocyte transformation rate under different hygienic conditions (n = 60). *Means that the difference between treatment groups (B–E) and control group (A) was significant. **Means that the difference between treatment groups (B–E) and control group (A) was extremely significant.