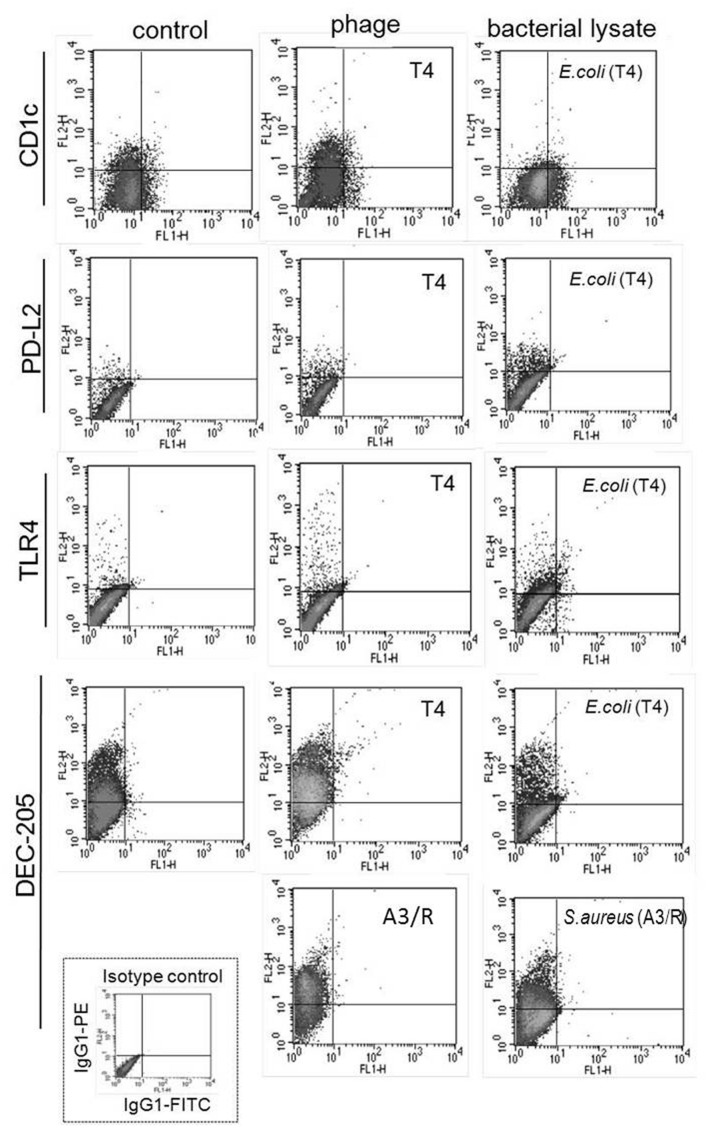
FIGURE 4.
Representative results of analysis of the expression of surface markers of mDCs differentiated in the presence of bacteriophage-generated bacterial lysates. Shown are representative density plots for markers for which statistically significant differences were found between mDCs differentiated in the presence of bacterial lysates and mDCs from control cultures (treated with PBS). In addition, the figure shows representative density plots for mDCs differentiated in the presence of bacteriophages. Anti-CD1c, anti-PD-L2, anti-TLR4, and anti-DEC-205 monoclonal antibodies were conjugated with phycoerythrine (PE). Shown is also a representative density plot for isotype control (IgG-PE).

