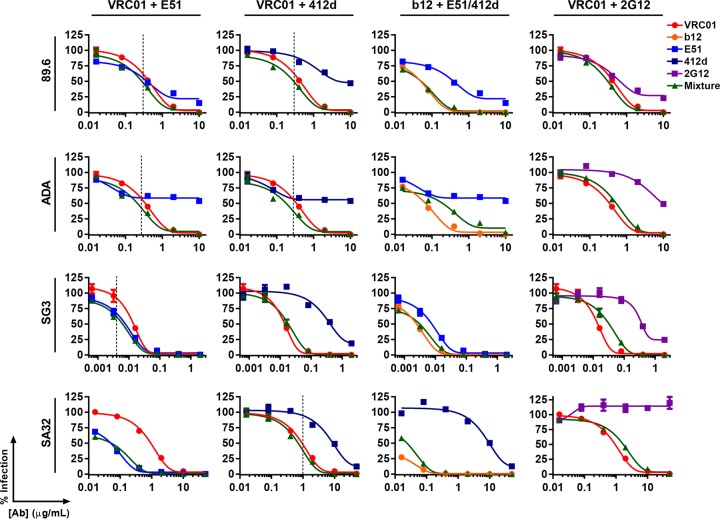
FIG 3.
In vitro neutralization curves of mixtures of VRC01 or b12 with E51, 412d, or 2G12. The experiment was similar to that described for Fig. 1 except that HIV-1 isolates 89.6, ADA, SG3, and SA32 was preincubated with various concentrations of indicated antibodies or mixture of antibodies. The dashed lines indicate the fixed concentration used for Fig. 1A and B. For the 89.6 and ADA neutralization curves, 50:50 mixtures of VRC01 and E51, VRC01 and 412d, b12 and E51, and VRC01 and 2G12 were used. For the SG3 neutralization curves, 25:75 mixtures of VRC01 and E51, b12 and E51, and VRC01 and 2G12 were used, while a 75:25 mixture of VRC01 and 412d was used (to accommodate for the lack of potency of 412d on SG3). For the SA32 neutralization curves, a 40:60 ratio of VRC01 and E51 was used, while 60:40 ratios of VRC01 and 412d, b12 and 412d, and VRC01 and 2G12 were used. All panels are representative of at least three independent experiments. IC50s are reported in Fig. 2. Error bars represent SEM.

