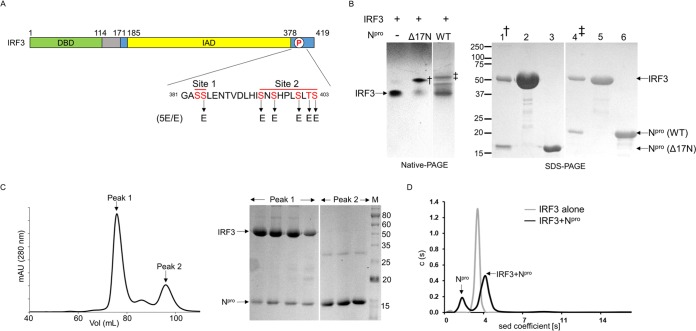
FIG 1.
Npro forms a complex with the full-length IRF3 monomer. (A) Schematic of IRF3 domains. IRF3 consists of the DNA-binding domain (DBD; green), a linker (gray), and the IRF association domain (IAD; yellow). The IAD contains the autoinhibitory region along with the C-terminal phosphorylation sites, sites I and II (blue). Residues in the phosphorylation (P) sites that were mutated to glutamic acid to generate the phosphomimetic mutant IRF3-5E/E are indicated. (B) Gel shift assay of IRF3 in the presence of full-length and Δ17N Npro. (Left) IRF3 alone and IRF3 mixed with either full-length Npro (lane WT [wild type]) or the N-terminal deletion mutant (lane Δ17N Npro) were loaded onto native polyacrylamide gels. The gels were spliced, indicated by a space between lanes, to facilitate viewing. Npro-IRF3 complexes (indicated by † and ‡) were eluted for SDS-PAGE analysis. (Right) SDS-PAGE of the Δ17N Npro-IRF3 complex (lane 1) and full-length Npro-IRF3 complex (lane 4) eluted from native polyacrylamide gels, along with that of purified IRF3 (lanes 2 and 5), Δ17N Npro (lane 3), and full-length Npro (lane 6). (C) (Left) Elution profile from size exclusion chromatography of IRF3 and Δ17N Npro protein solution. The absorbance at 280 nm was monitored. mAU, milli-absorbance units. (Right) SDS-PAGE of the fractions from the two peaks. Peak 1 contains both IRF3 and Δ17N Npro coeluting from the column. Excess unbound Npro in the protein mix eluted at a higher volume in peak 2. (D) Sedimentation (sed) velocity profiles of IRF3 alone and the Δ17N Npro-IRF3 complex. IRF3 is a monomer with a molecular mass of 42 kDa. The Npro and IRF3 mixture shows peaks corresponding to free Npro (∼19 kDa) and the bound 1:1 complex of IRF3 and Npro (∼57 kDa). The numbers to the left and right of the SDS-PAGE gels are molecular masses (in kilodaltons).

