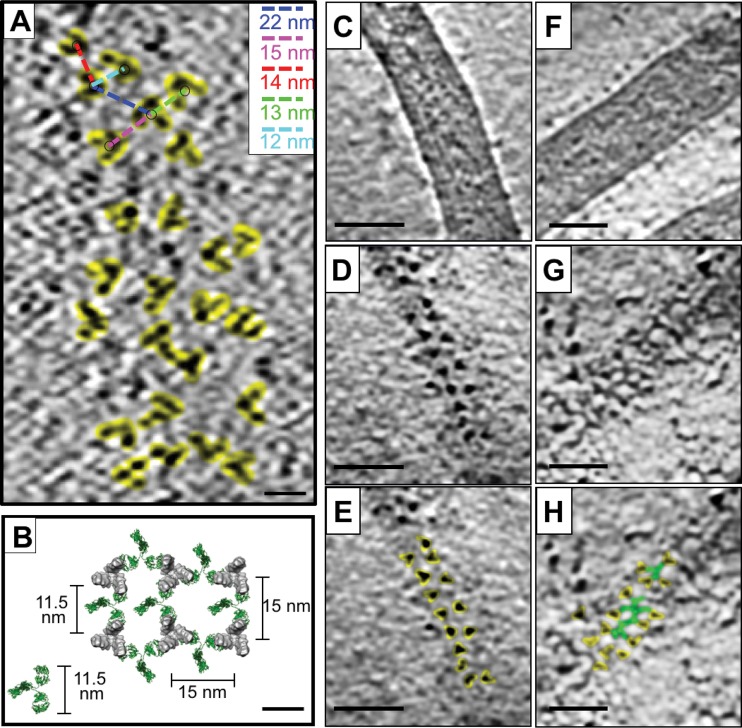
FIG 2.
Spacing of GP spikes on EBOV-Makona VLP surface and potential for bridging by base-specific antibodies. (A) A tomographic slice of an unbound EBOV-Makona VLP surface shows top views of trimeric GP proteins (highlighted in yellow). Center-to-center distance between spikes (indicated on representative GP spikes with colored dashed lines) is shown in the upper right corner inset. The distance corresponding to each dashed line is shown in the same color as the line. (B) A model of GP spikes on the surface of EBOV-Makona VLPs is shown using a top view of the cryo-EM structure of unbound GP. GP spikes are spaced 15 nm apart. The measured distance between the base portion of the maps is 11.5 nm, as indicated. A model IgG molecule (PDB accession number 1IGT) is shown in green. IgG molecules are placed between the GP spikes to indicate that the two Fab arms of a single IgG molecule can bridge two neighboring GP spikes. (C to E) Denoised tomographic slices through an EBOV-Makona VLP show views through the center (C) and top (D and E) of a VLP. In panel E, top views of the trimeric GP molecule are highlighted in yellow. (F to H) Denoised tomographic slices through an EBOV-Makona VLP after incubation with c4G7 IgG show views through the center (F) and top (G and H) of the VLP. In panel H, top views of the trimeric GP molecule are highlighted in yellow, while lines of density between the spikes are highlighted in green. Scale bars, 10 nm (A and B) or 50 nm (C to H).

