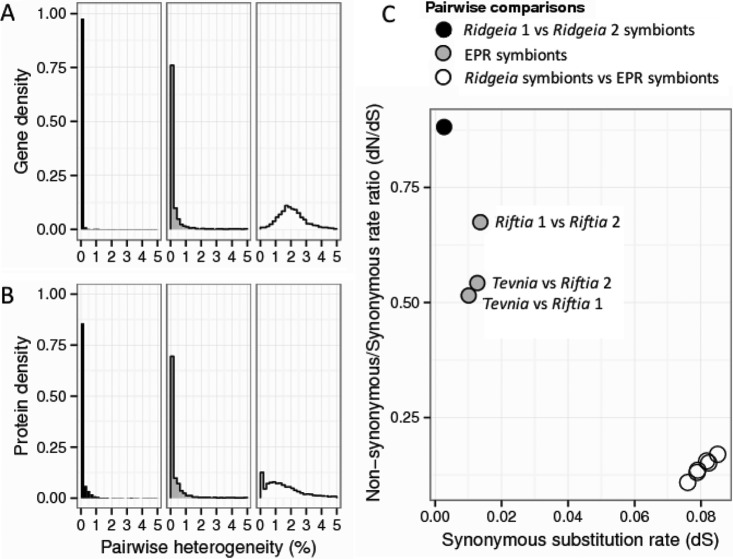
FIG 3.
(A and B) Distribution of heterogeneity between pairs of homologous genes based on nucleotide sequences (A) and amino acid sequences (B). Only heterogeneities of <5% are represented (>90% of data). (C) Negative correlation of the dN/dS ratio with divergence between individuals from different metapopulations based on the concatenated alignments of 2,313 homologous gene sequences (1,926,255 bp). See Data Set S1 in the supplemental material for details.

