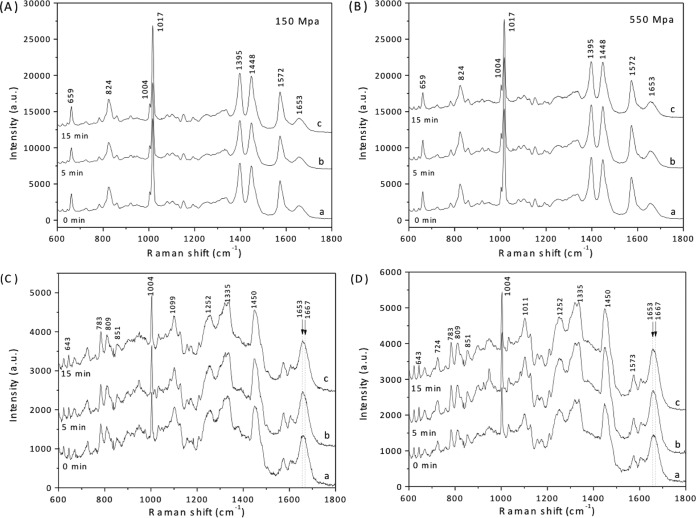
FIG 5.
Average Raman spectra of C. perfringens spores exposed to HP for various times. Unactivated C. perfringens spores were exposed to HP of 150 (A and C) or 550 (B and D) MPa for various times, and average Raman spectra of ∼30 spores that retained DPA (A and B) and ∼30 spores that did not retain DPA (C and D) after HP exposure for 0 min (curves a), 5 min (curves b), or 15 min (curves c) were obtained as described in Materials and Methods. Raman peaks at 824, 1,017, 1,395, and 1,572 cm−1 are due to CaDPA. The region around 1,653 to 1,667 cm−1 in these Raman spectra contains peaks that are from proteins in either the α-helical (1,653 cm−1) or unstructured (1,667 cm−1) conformation, as described in the text.

