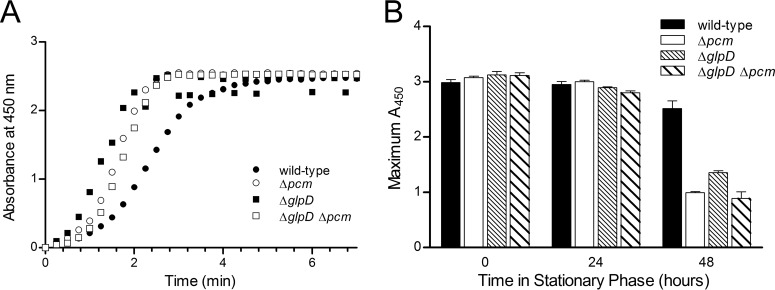
FIG 3.
Metabolic capability of mutants in stationary phase. (A) Reduction of WST-1 by cells maintained 24 h in stationary phase. Normalized absorbance at 450 nm (A450) due to reduced WST-1 is shown versus time after WST-1 addition to cultures of strains JV1120 (wild type; ●), JV1121 (Δpcm; ○), JV1136 (ΔglpD; ■), or JV1154 (Δpcm ΔglpD; □). One representative experiment of three is shown. (B) Reduction of WST-1 by cells maintained in stationary phase for 0, 24, or 48 h; maximum absorbance due to reduced WST-1 is shown and was determined by the same assay used for the experiment whose results are shown in panel A for cultures of JV1120 (black bars), JV1121 (white bars), JV1136 (dense stripes), or JV1154 (wider stripes). n = 3; error bars represent one standard deviation.

