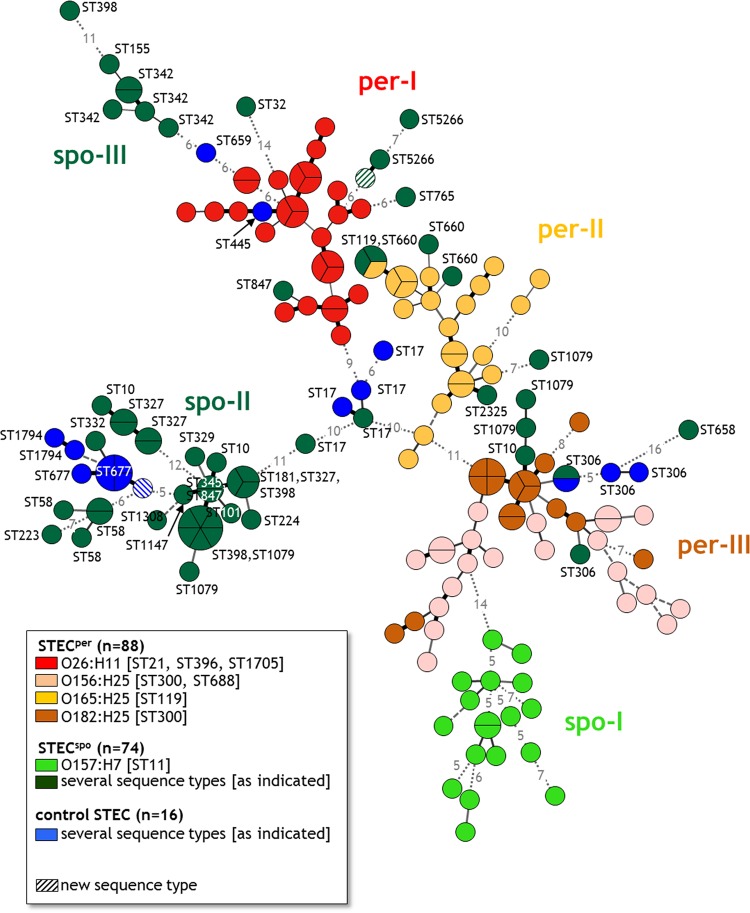
FIG 2.
Minimum spanning tree demonstrating the correlation between VAG pattern and MLST sequence type of 178 bovine E. coli isolates. Results of the microarray analysis. BioNumerics version 6.6, minimum spanning tree of binary character data. Each circle represents a single VAG pattern and each section of a circle a single isolate with the respective VAG pattern. The number of differing genes between two patterns is depicted by different types of lines: thick black line, 1-gene difference; thin black line, 2-gene difference; thin gray line, 3-gene difference; dashed gray line, 4-gene difference; dotted gray line, >4-gene difference (numbers of different genes are indicated by numbers within the lines). per-I to per-III, three clusters with predominantly persistent STEC isolates (STECper); spo-I to spo-III, three clusters with predominantly sporadic colonizing STEC isolates (STECspo).

