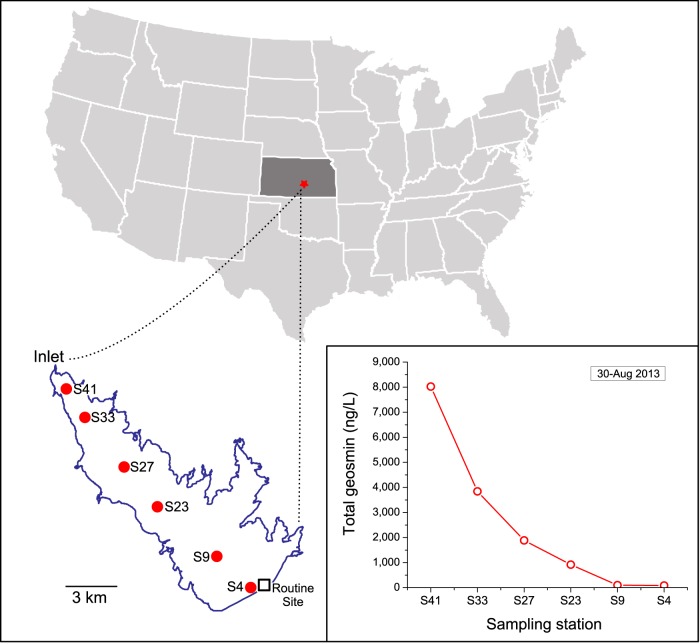
FIG 1.
Map of Cheney Reservoir sampling sites; the square symbol indicates where routine monitoring occurs, and red circles indicate transect sample collection sites. The inset graph displays an unusual geosmin event that occurred across the reservoir on 30 August 2013. Maps were created using Inkscape v0.91.

