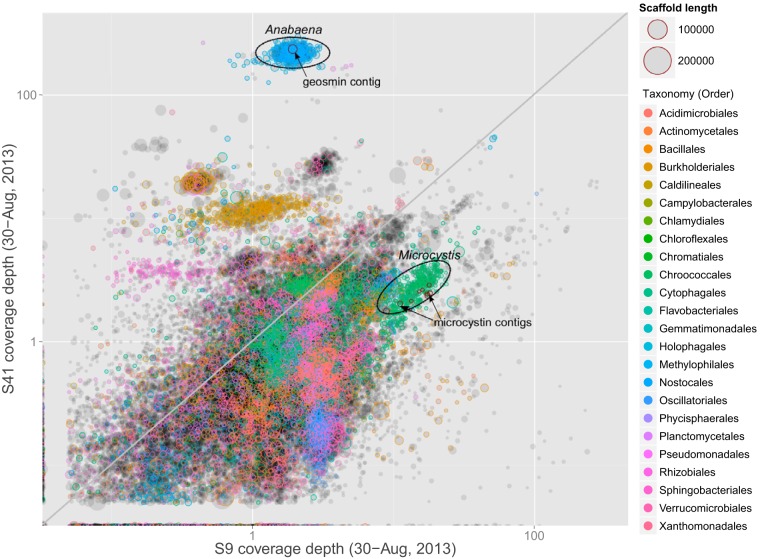
FIG 2.
Visual representation of assembled contigs and their relative read coverage depths (logarithmic scale, ∼0.1 to 300) for two samples collected at opposite ends of the reservoir (S41, inflow; S9, near outflow) on 30 August 2013. Contigs containing geosmin or microcystin synthase genes are highlighted. Contig colors denote taxonomic groupings at the level of order, with larger circles representing longer contigs (scaffolds). Contig clusters that represent the genomes of Anabaena and Microcystis are circled.

