FIG 3.
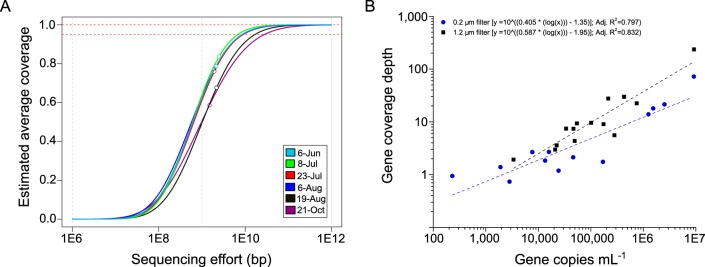
(A) Nonpareil curves (33) estimating the average coverage (completeness) of metagenomic data sets (taxa detected relative to estimated number of taxa present) obtained from sequencing samples collected onto 0.2-μm filters. Empty circles denote the actual sequencing effort (base pairs of sequence recovered); dashed red lines indicate 95% and 100% coverage levels. (B) Relationship between gene abundance (copies per milliliter) determined by qPCR and shotgun metagenome coverage depth of the target gene (geoA and mcyE) from samples collected onto glass fiber (1.2-μm pore size) or membrane (0.2-μm pore size) filters; each metagenome was normalized to 29.6 million reads. Adj. R2, adjusted R2.

