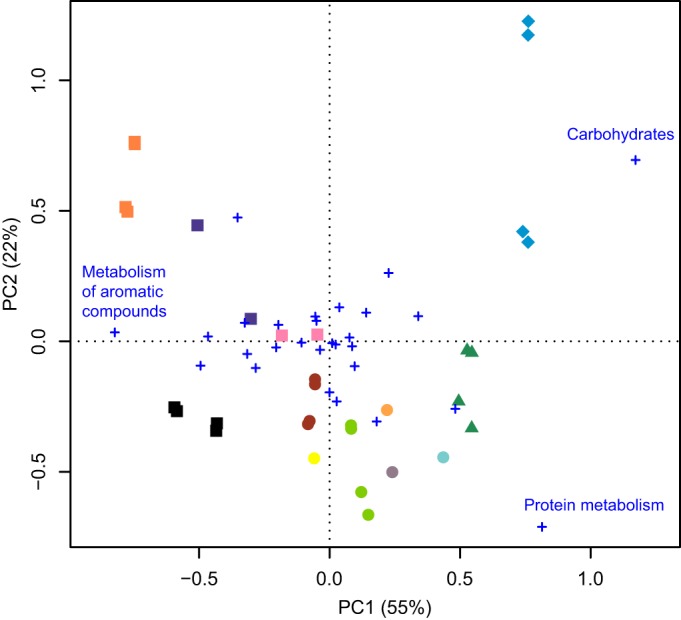
FIG 3.

Principal-component analysis of the abundance of SEED subsystems at level 1. Activated sludge samples are labeled according to the WWTP (different colors) and the type of wastewater treated (circles, municipal; squares, petrochemical; triangles, textile dyeing; diamonds, whey processing). Functional categories (crosses) were labeled only in cases in which PC1 was at least |0.5|. Technical replicates and data from the two different sampling times were included separately.
