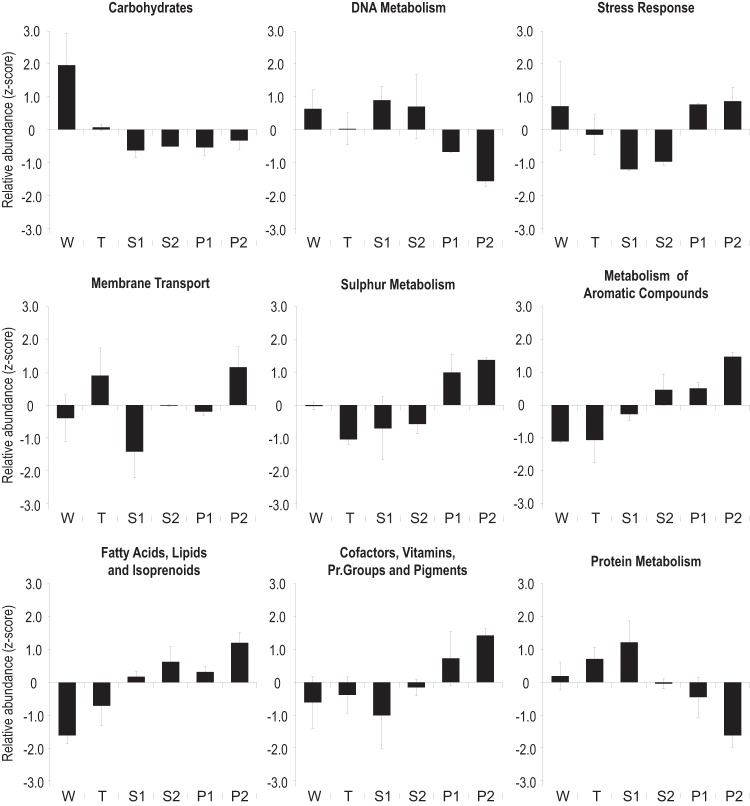
FIG 5.
Comparison of subsystems (level 1) among assembled metagenomic reads. Relative abundance values of functional categories at the two sampling points were transformed to Z-scores and averaged. W, whey filtering; T, textile dyeing; S1 and S2, municipal; P1 and P2, petrochemical; Pr., prosthetic. Error bars, standard deviations.

