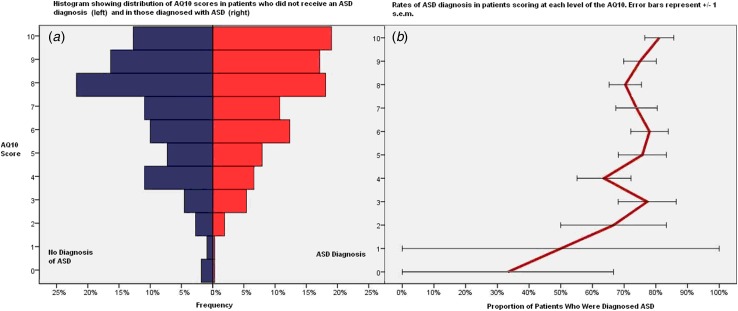
Fig. 1.
Distribution of 10-item Autism-Spectrum Quotient (AQ10) scores in patients according to whether they subsequently received a clinical diagnosis of autism spectrum disorder (ASD). (a) Histograms showing the proportion of patients who did not receive an ASD diagnosis (left) and of those who did receive a diagnosis (right) scoring at each level on the AQ10 (score out of 10). (b) Proportion of those scoring at each level of the AQ10 who received an ASD diagnosis. Values are means, with standard errors (s.e.m.) represented by horizontal bars. For a colour figure, see the online version.

