
Figure 3.
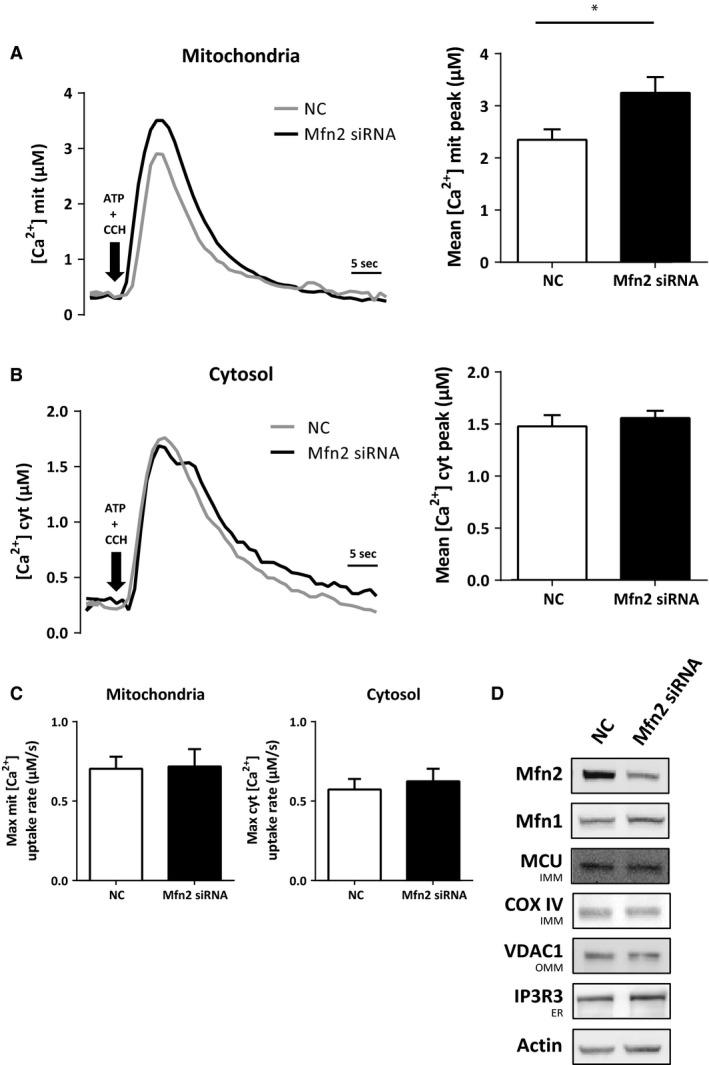
Mfn2 knockdown increases Ca2+ transfer between ER and mitochondria. (A) Mitochondrial Ca2+ peak upon stimulation of ER Ca2+ release with ATP and carbachol (CCH) or (B) cytosolic Ca2+ peak in NC and Mfn2 siRNA‐treated cells and (C) respective rise rates. Sample size varied between 8 ≤ n ≤ 10 (independent experiments), with triplicates for each condition. Results are shown in mean ± S.E.M. Independent t‐test was used for statistical analysis. *P < 0.05. (D) Western blot of whole cell homogenates from cells treated either with NC or Mfn2 siRNA. Membranes were stained for indicated proteins. COX IV was used as a mitochondria marker NC: negative control; Mfn2 siRNA: siRNA for Mfn2 mRNA.