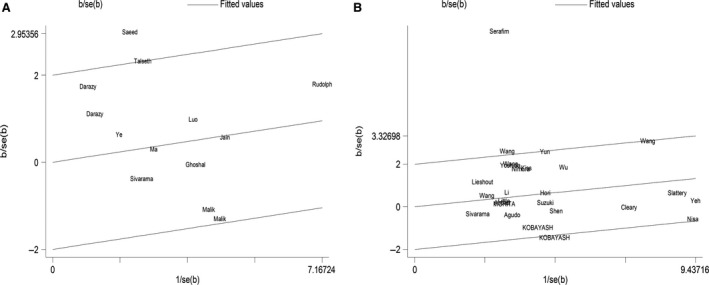
Figure 3.

(A) Galbraith graph for MspI polymorphism (the dominant model CC + CT versus TT): the study conducted by Saeed et al. may be the main source of heterogeneity. (B) Galbraith graph for Ile/Val polymorphism (the dominant model GA+GG versus AA): the study conducted by Pereira Serafim et al. may be the main source of heterogeneity.
